Feature tour
The console, in the order you'd actually use it
Dashboard
A glanceable overview: severity counts, top techniques, and a real agent-health
indicator that polls actual check-ins rather than showing a hardcoded "online" badge.
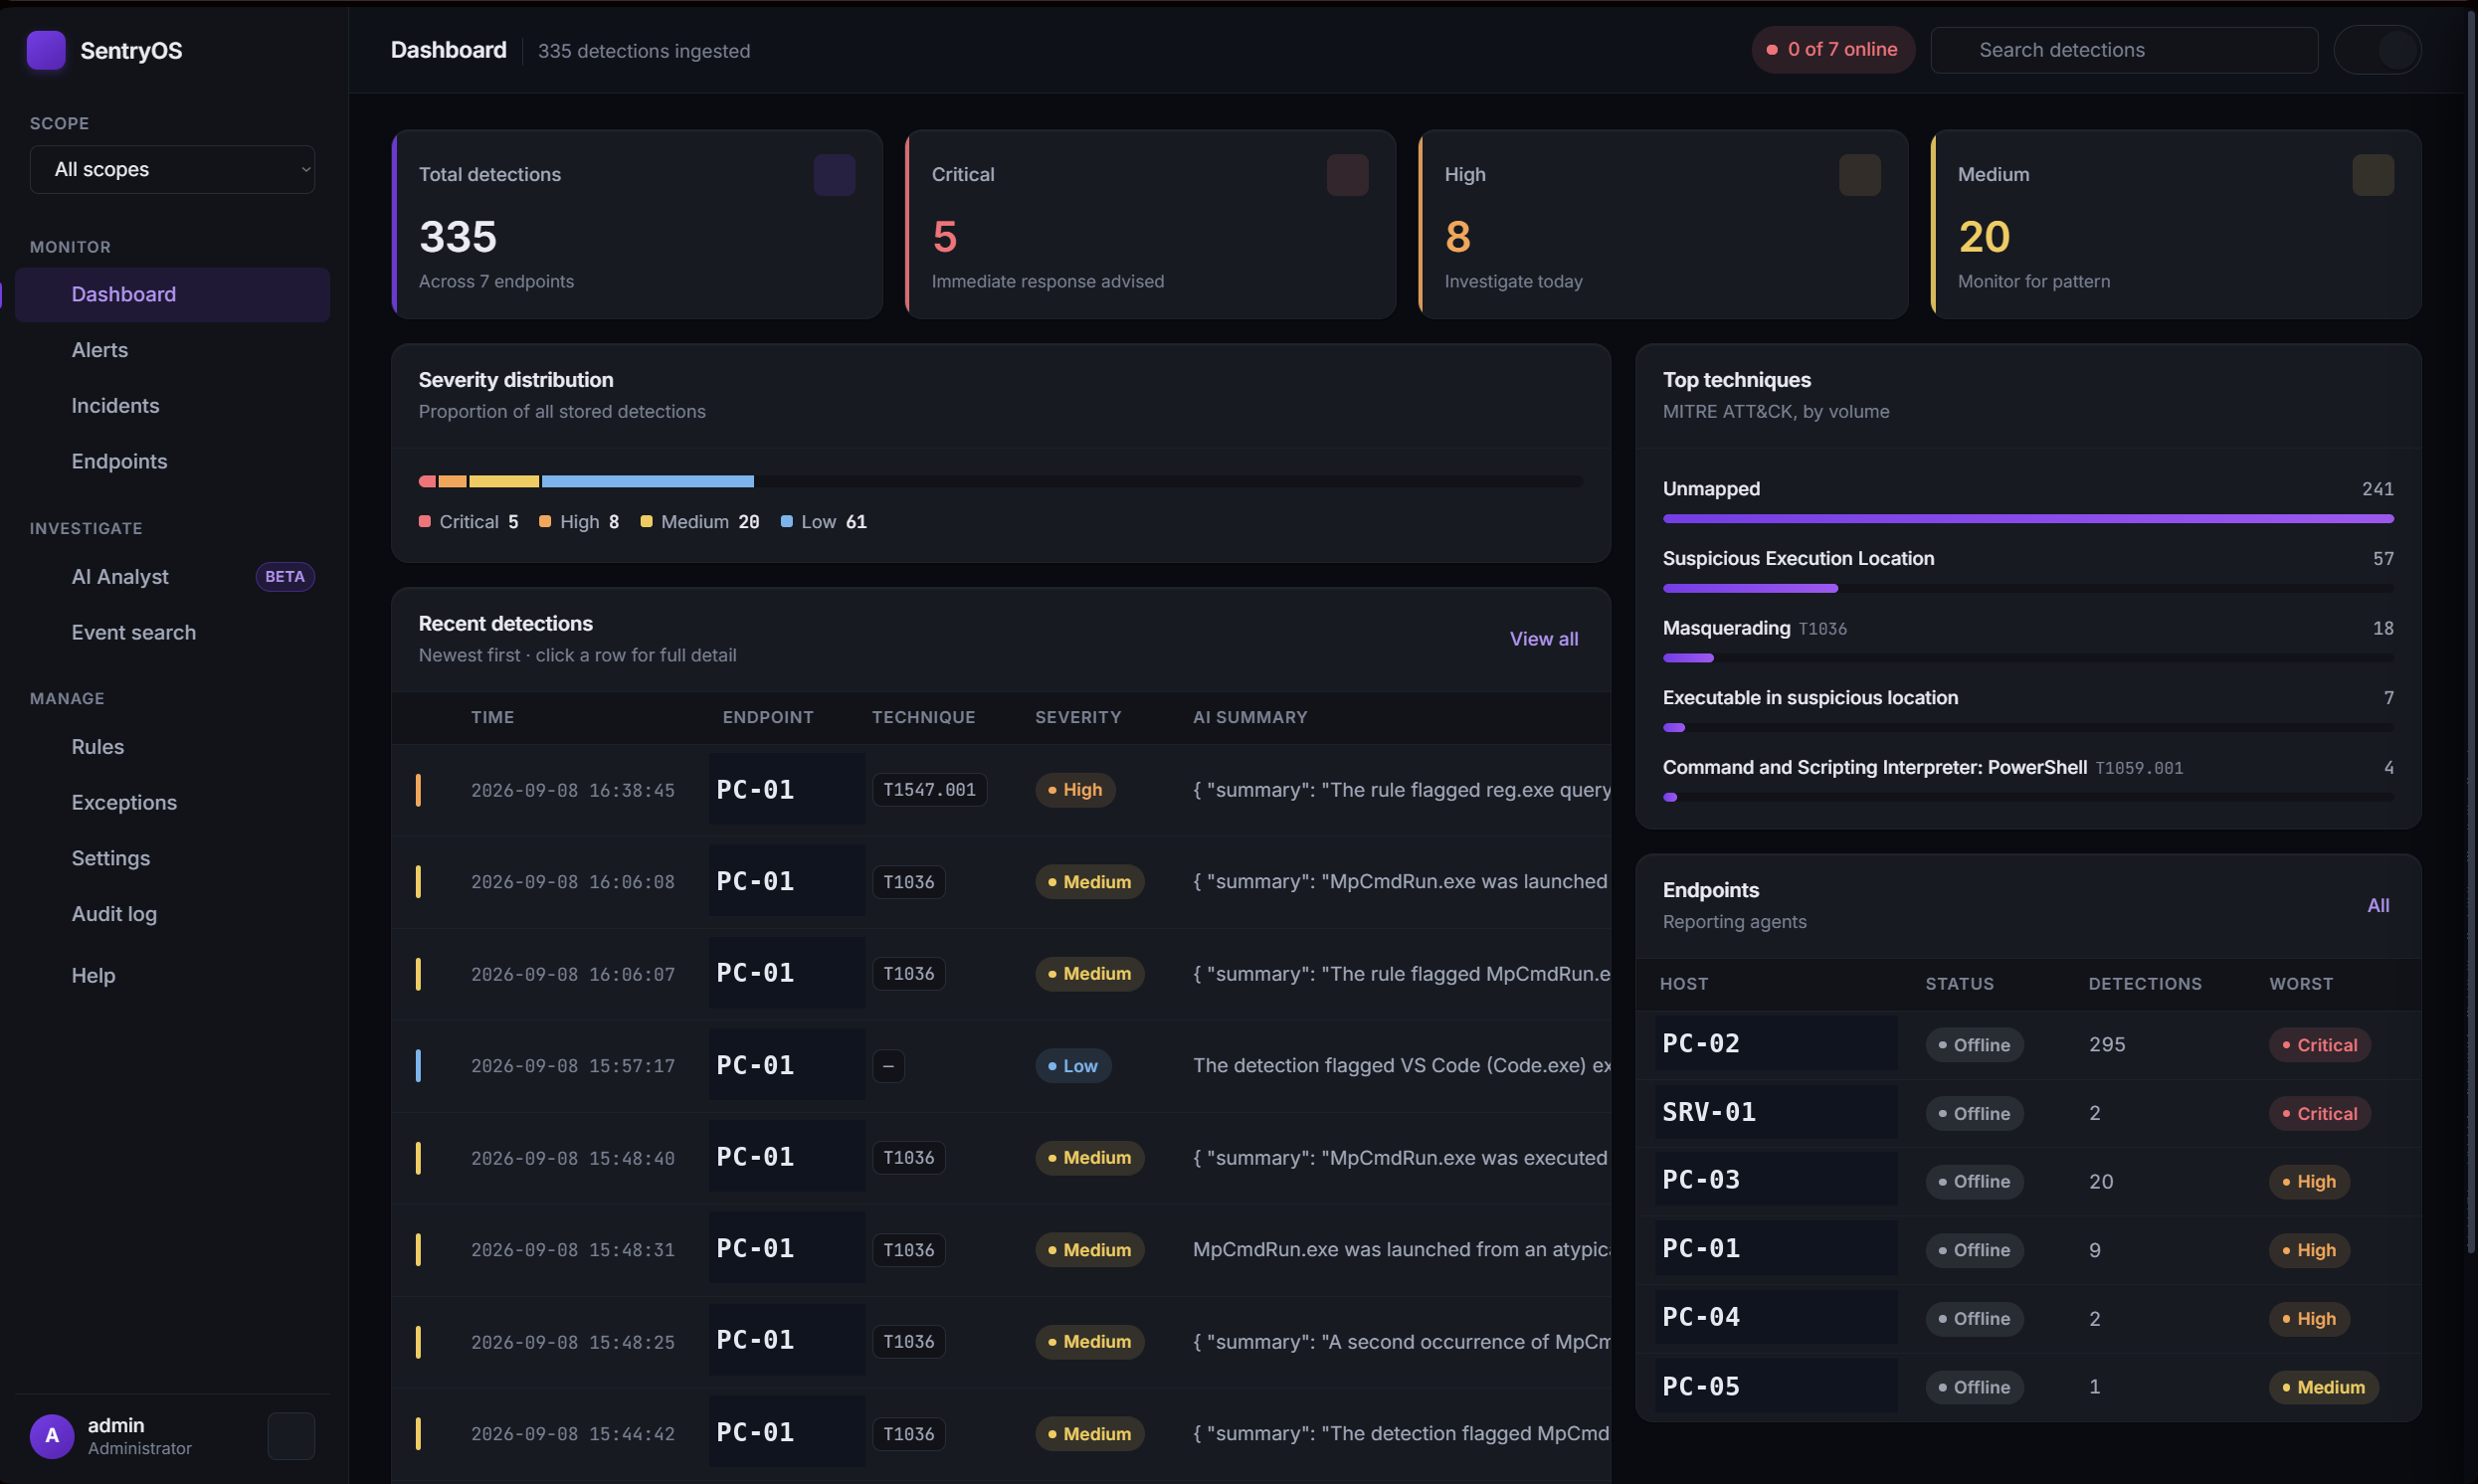
dashboard-sanitized.png
Before going further: how this is actually running
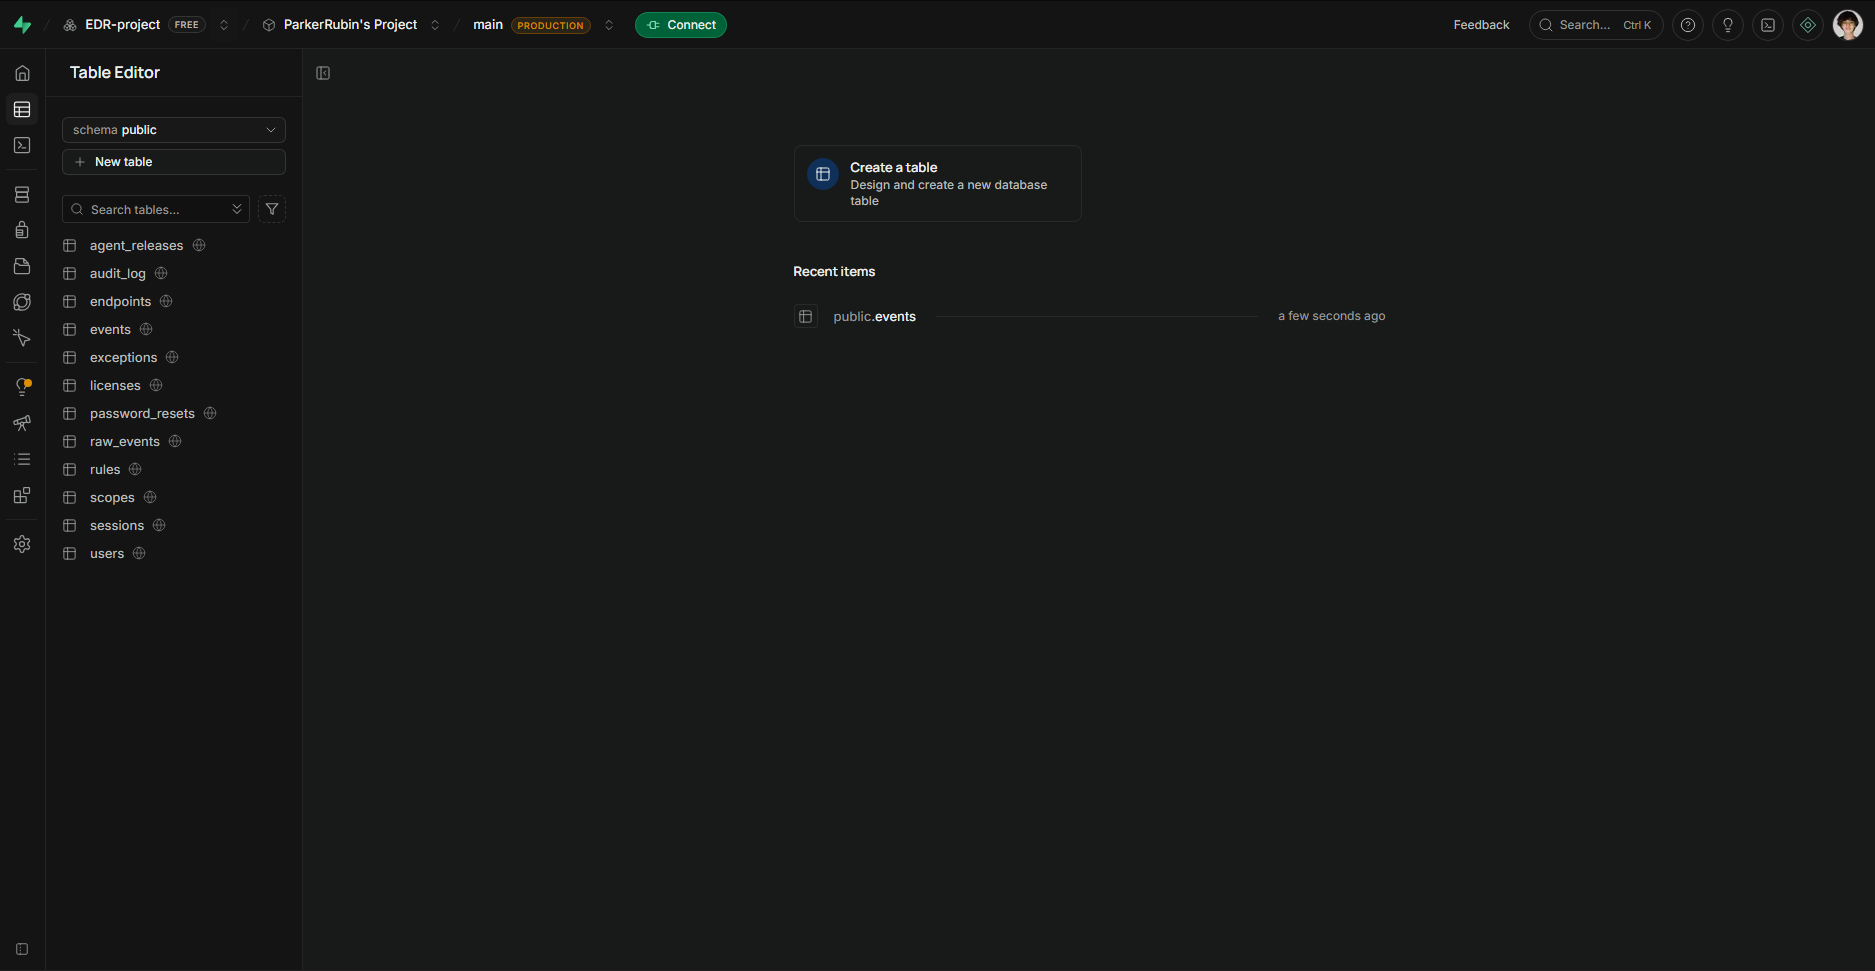
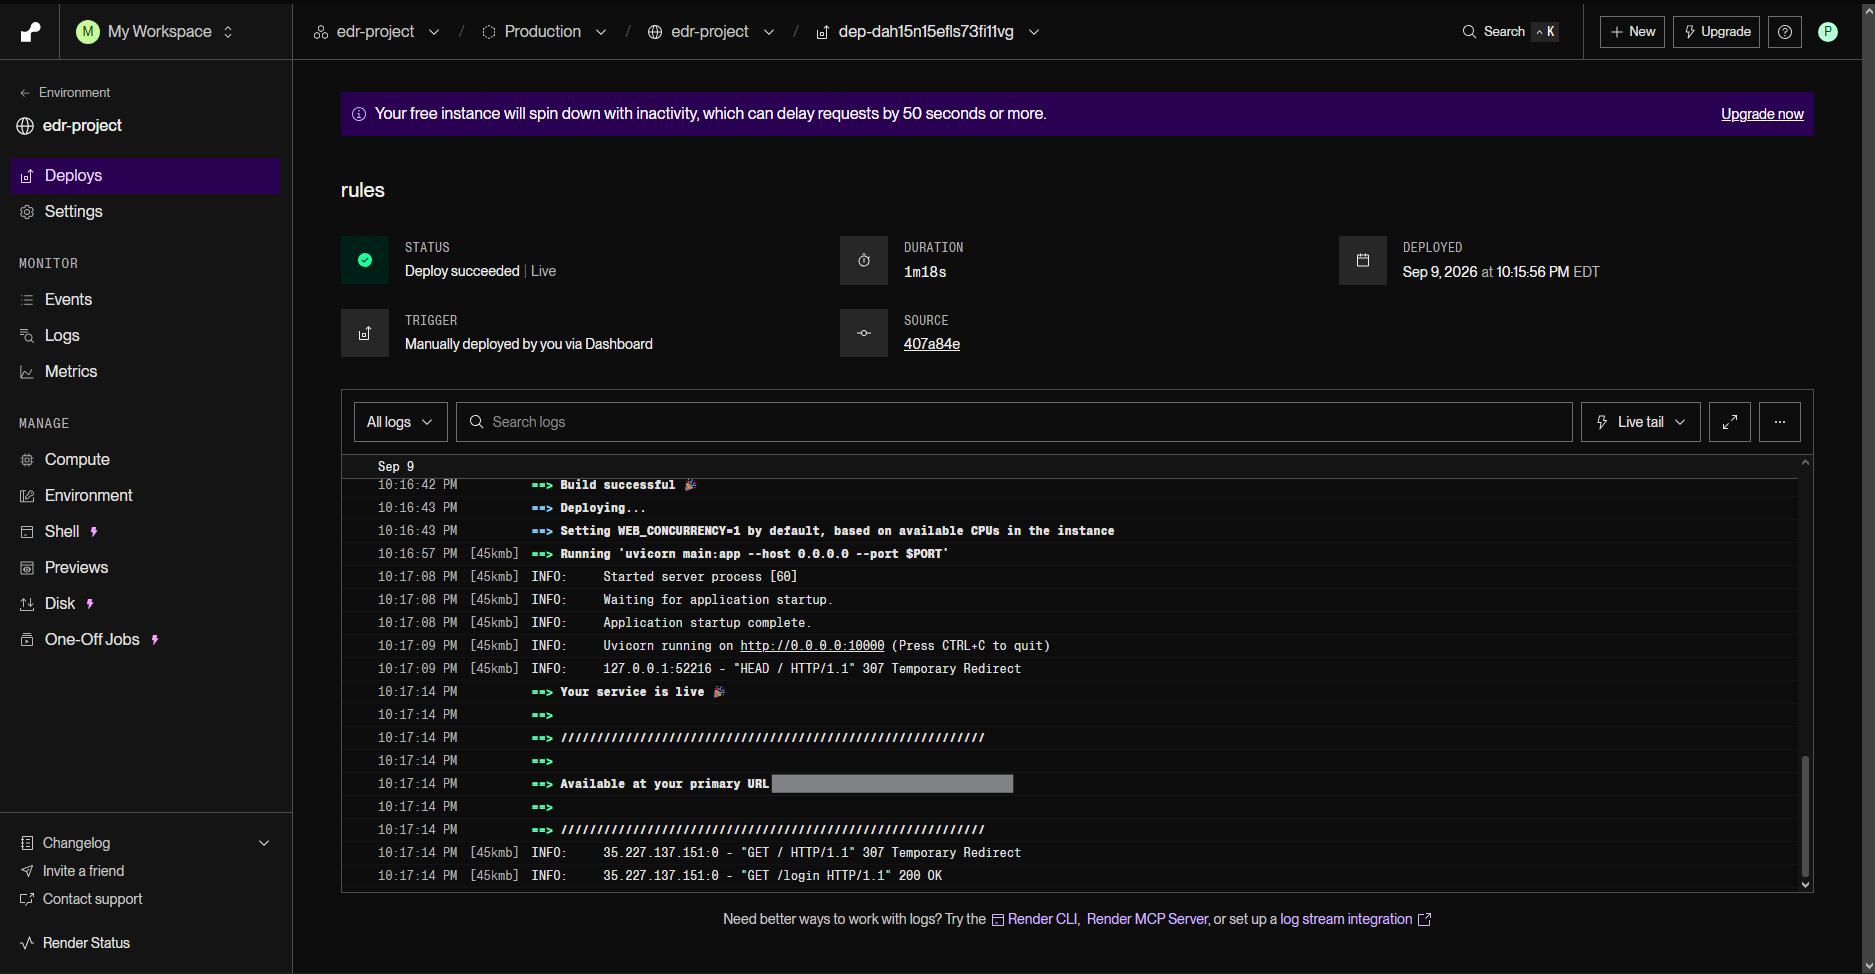
This isn't a local demo. The backend is a FastAPI service deployed on Render,
and every event, rule, user, and license key lives in a Supabase Postgres
database, both free-tier, both run like a real (if small) production service,
cold starts and all. Everything below is a screenshot of that live system, not
a mockup.
supabase-tables-sanitized.png
render-deploy-sanitized.png
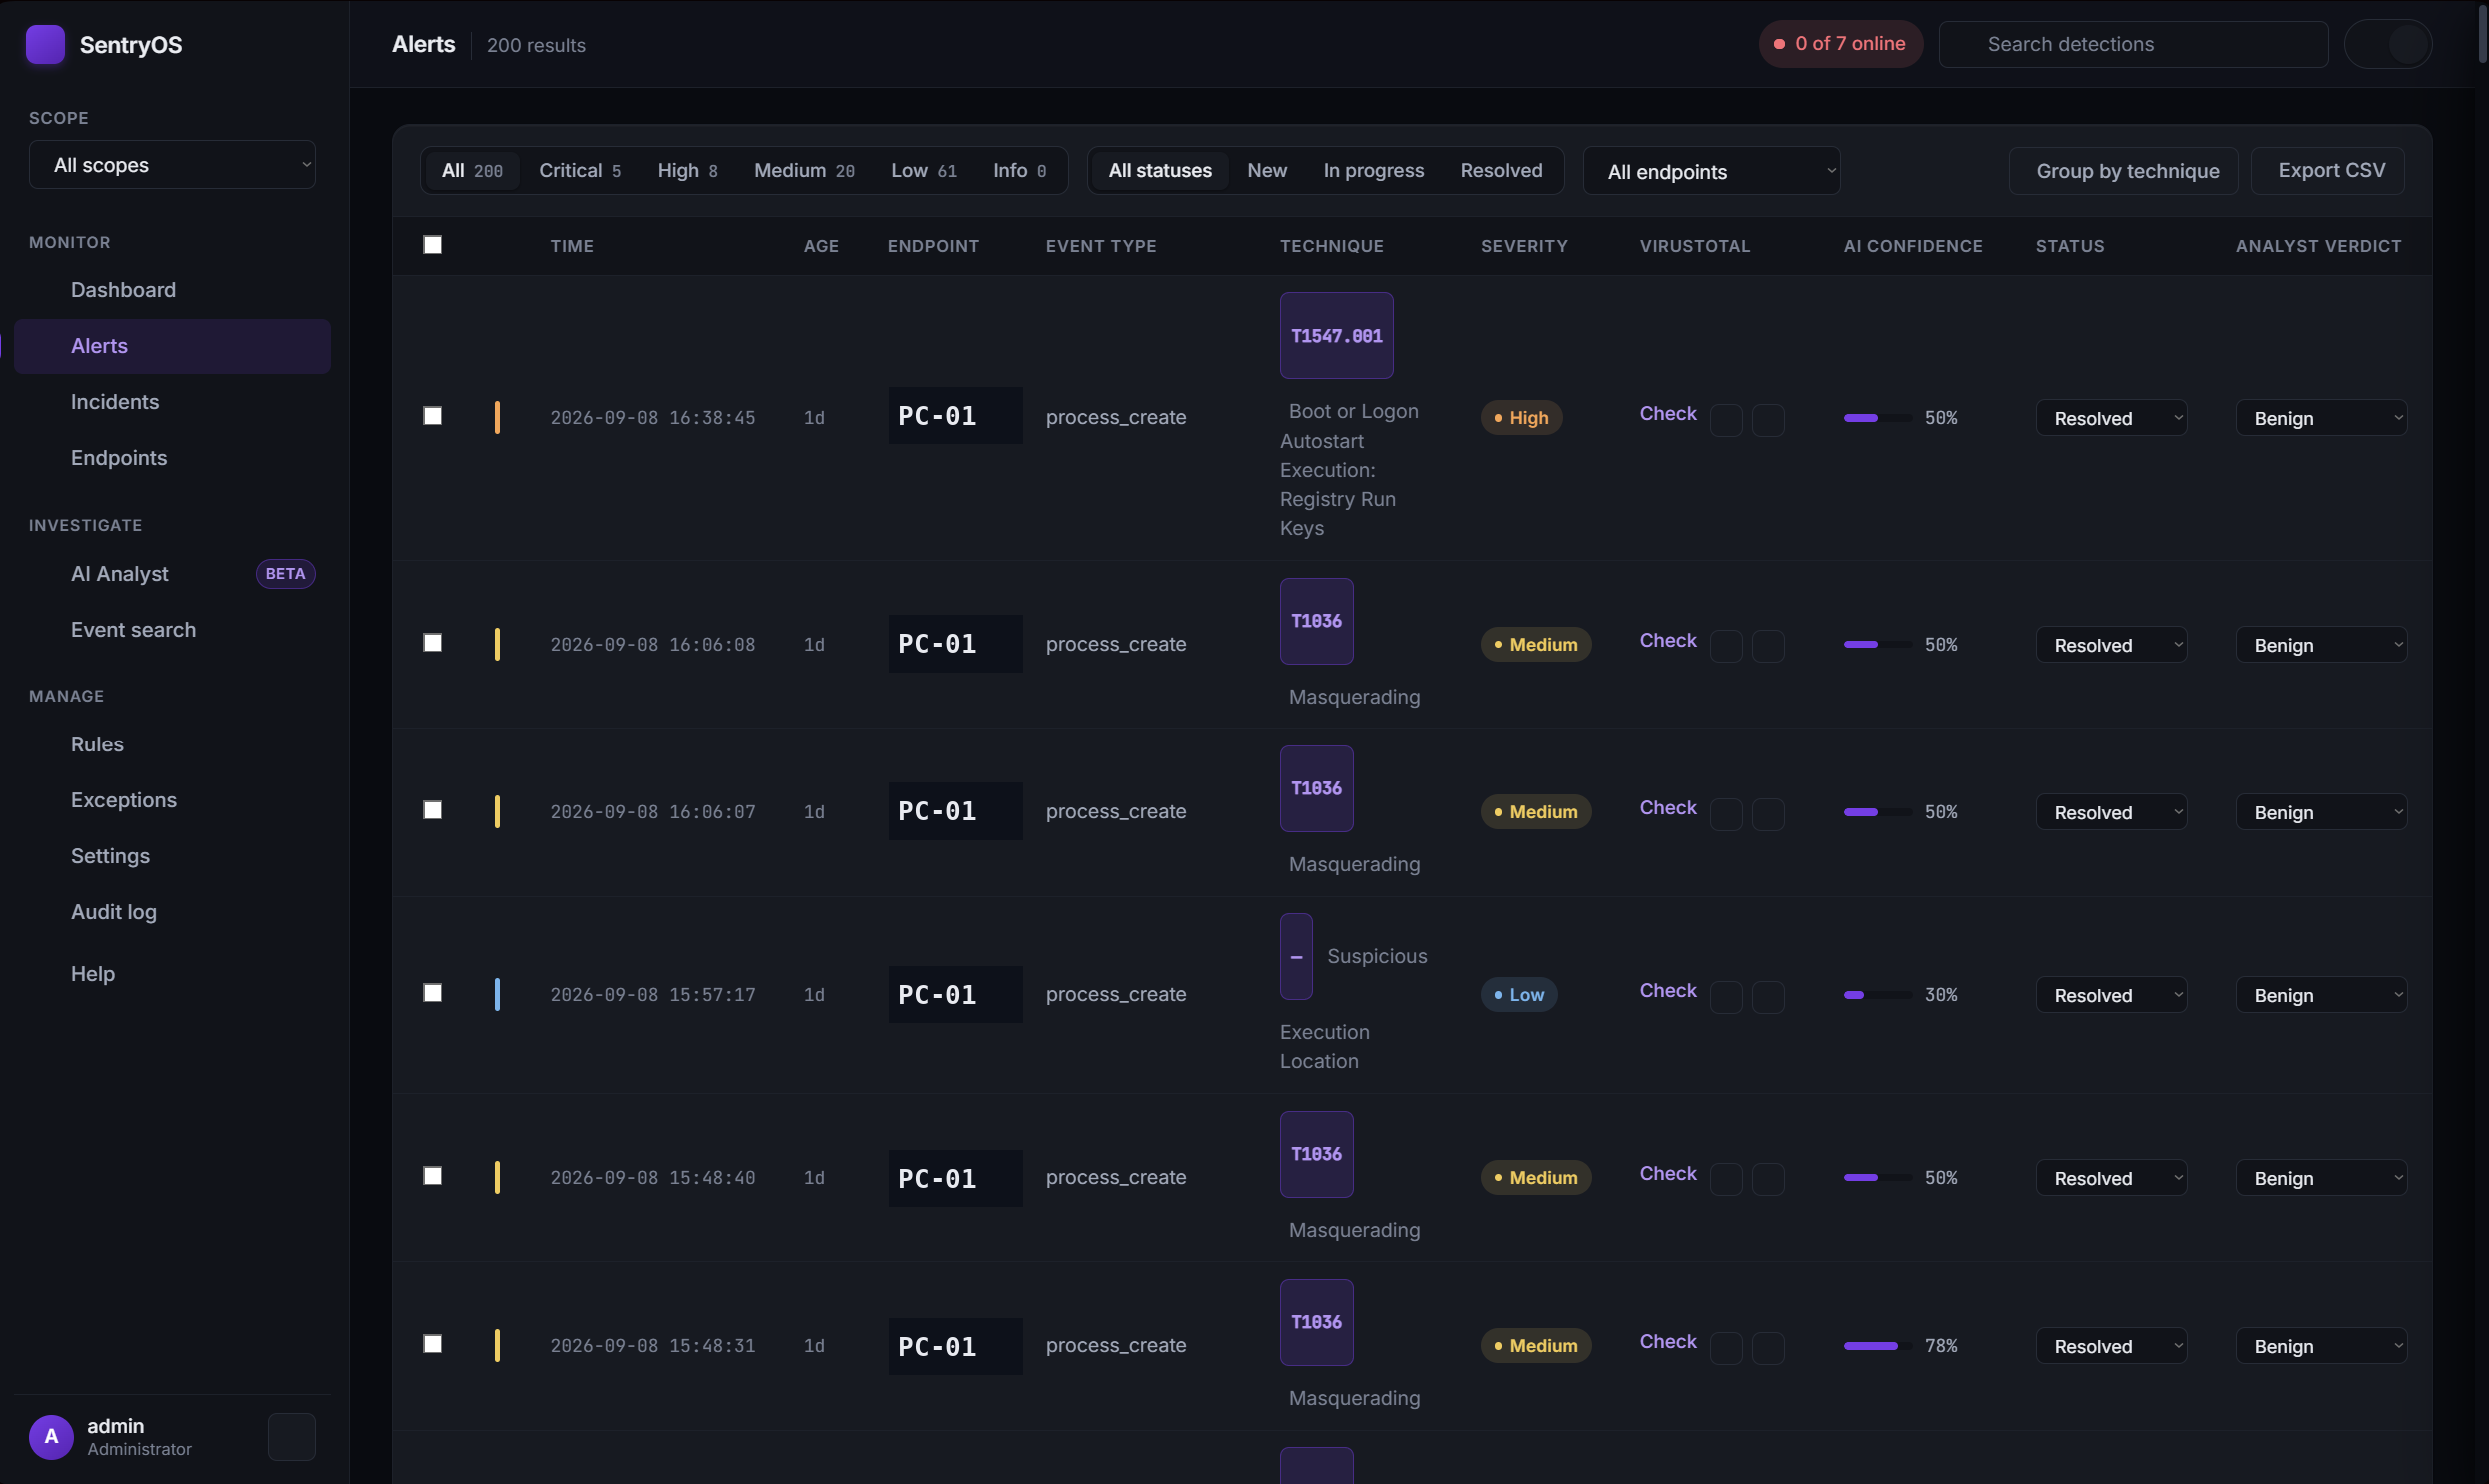
Alerts, with real process lineage
Click into any detection and see the actual parent → child process chain pulled
from Sysmon telemetry, not a description of it. Bulk actions let you resolve, tag a
verdict, or leave a note across several alerts at once.
alerts-list-sanitized.png
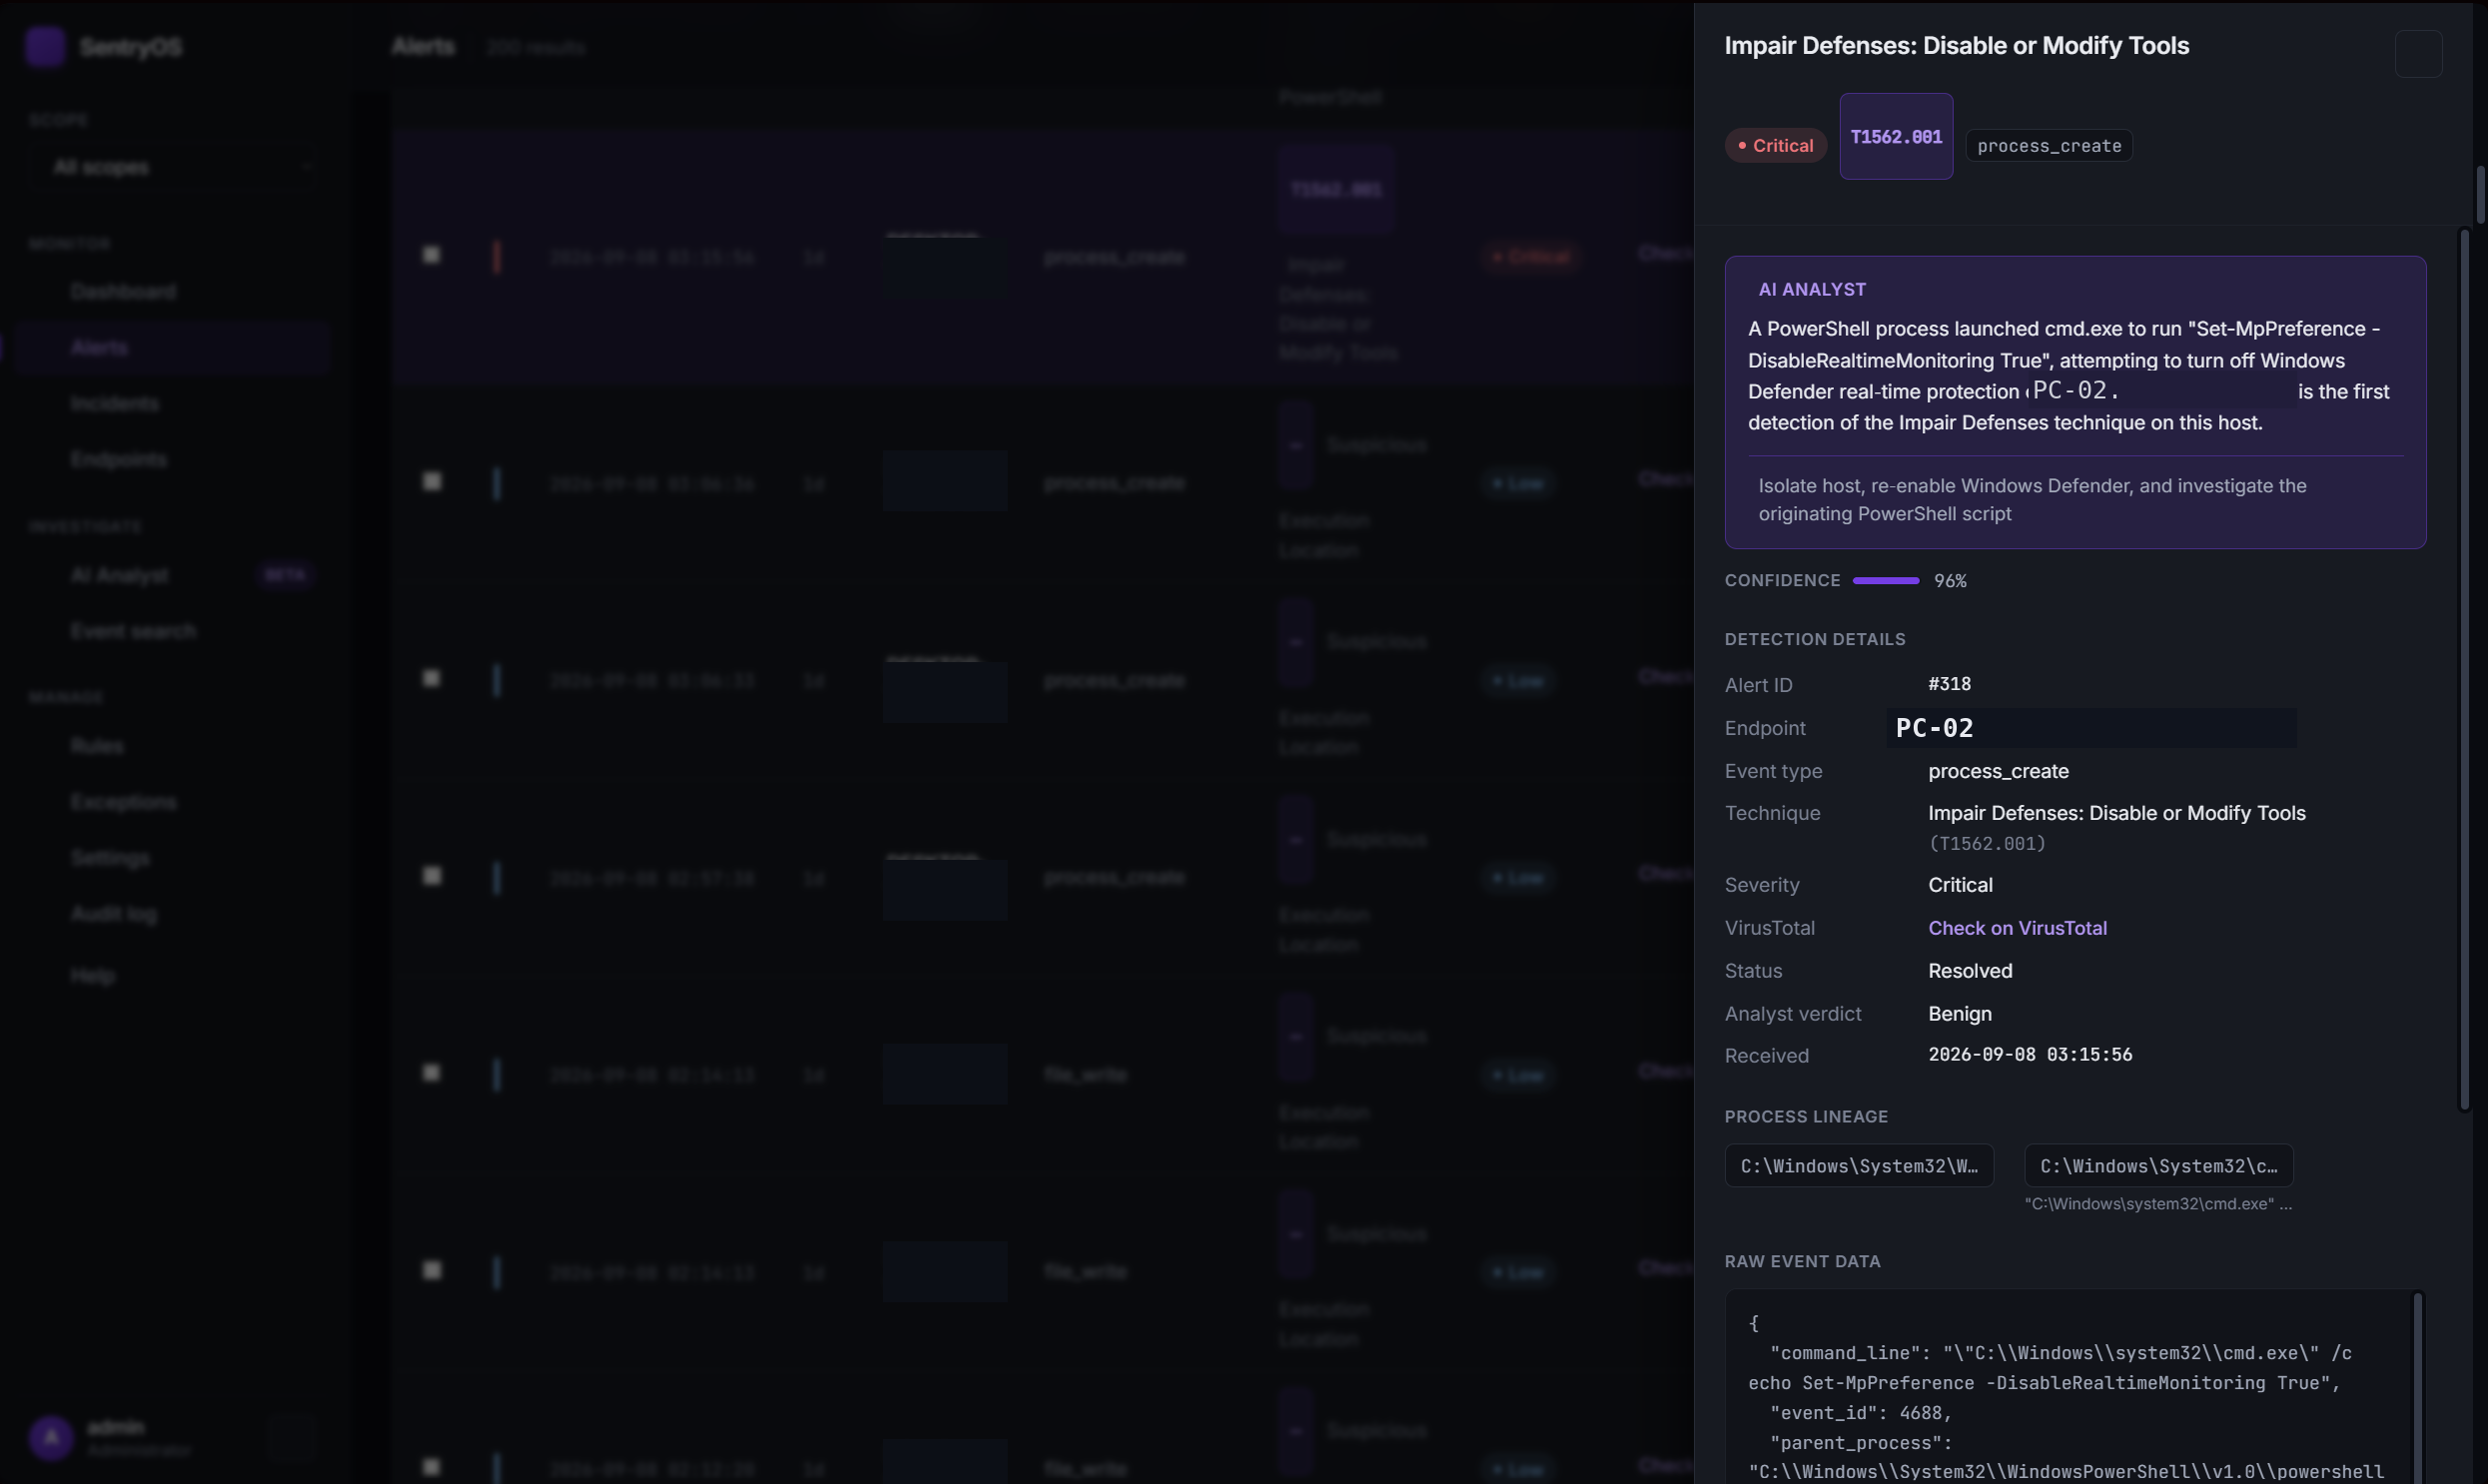
alerts-drawer-sanitized.png
Incidents
Related alerts on the same host, close together in time, get correlated into one
incident instead of showing up as five disconnected rows, a small step toward
telling a story instead of a list.
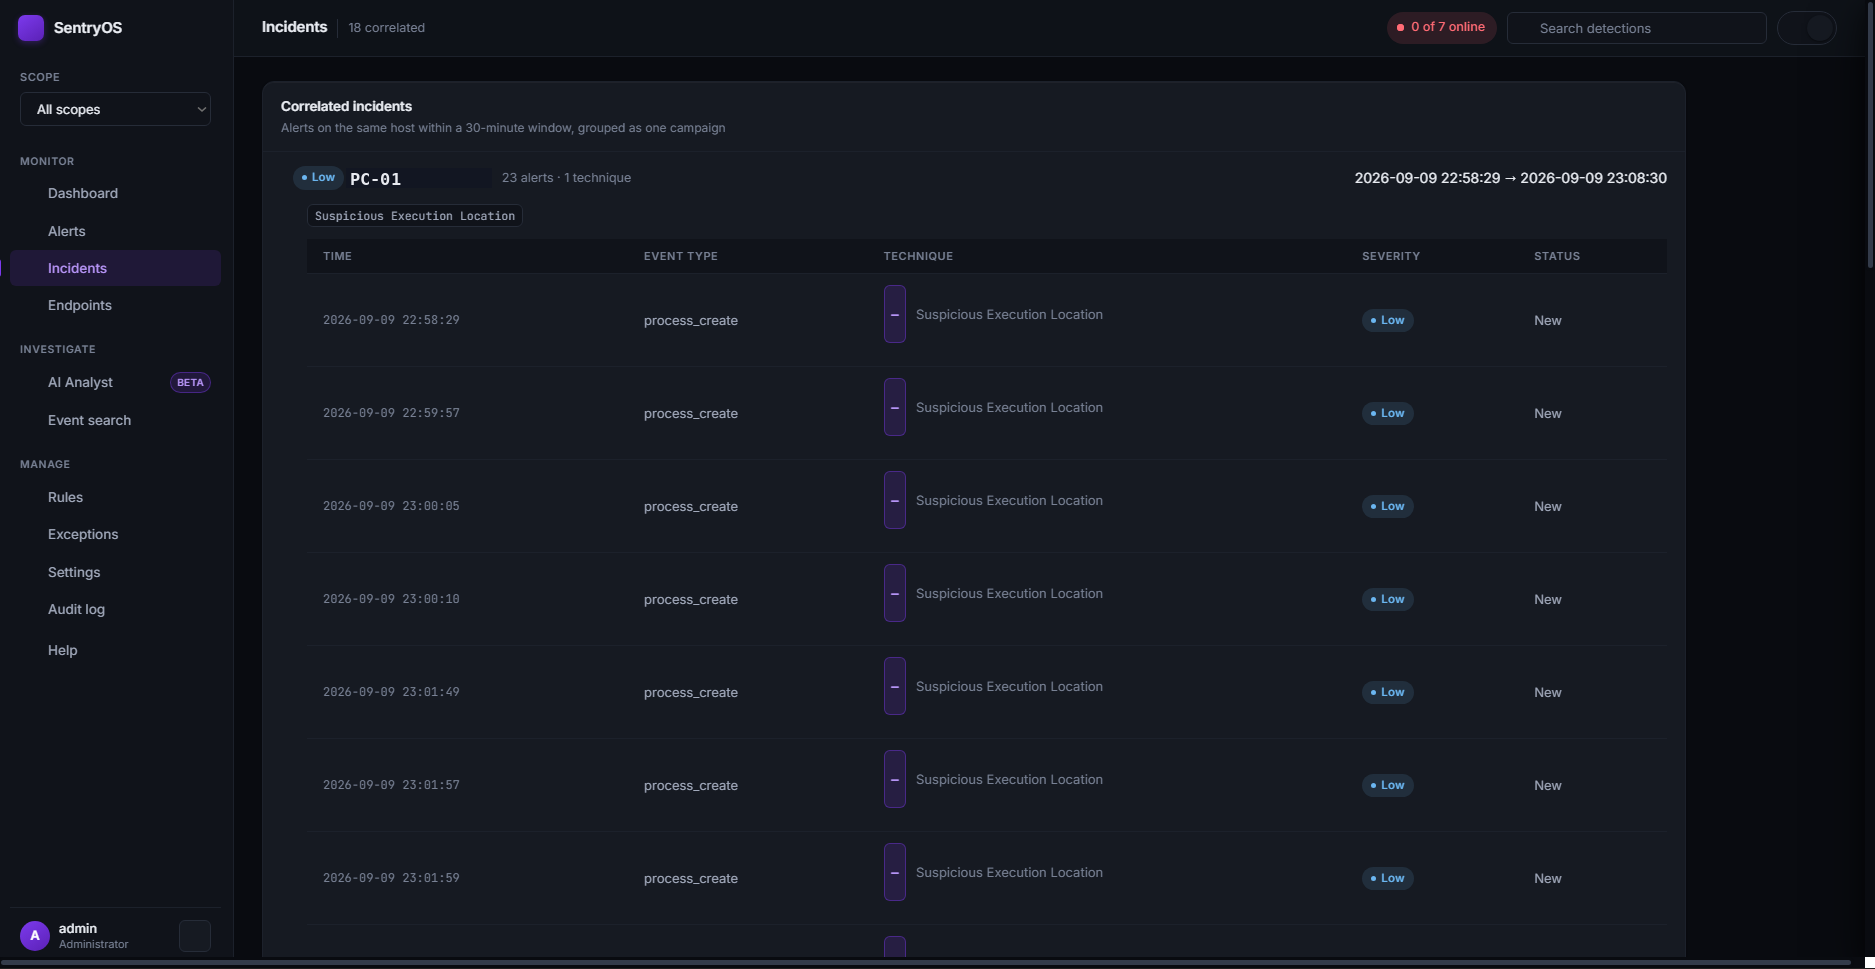
incidents-sanitized.png
Endpoints
Every machine that's ever activated shows up here, not just the ones that
happened to trigger an alert. Agent status (online, stale, offline), reported
version, and a per-host severity mix make this the place to check whether the fleet
is actually healthy, a separate question from whether anything's actually wrong.
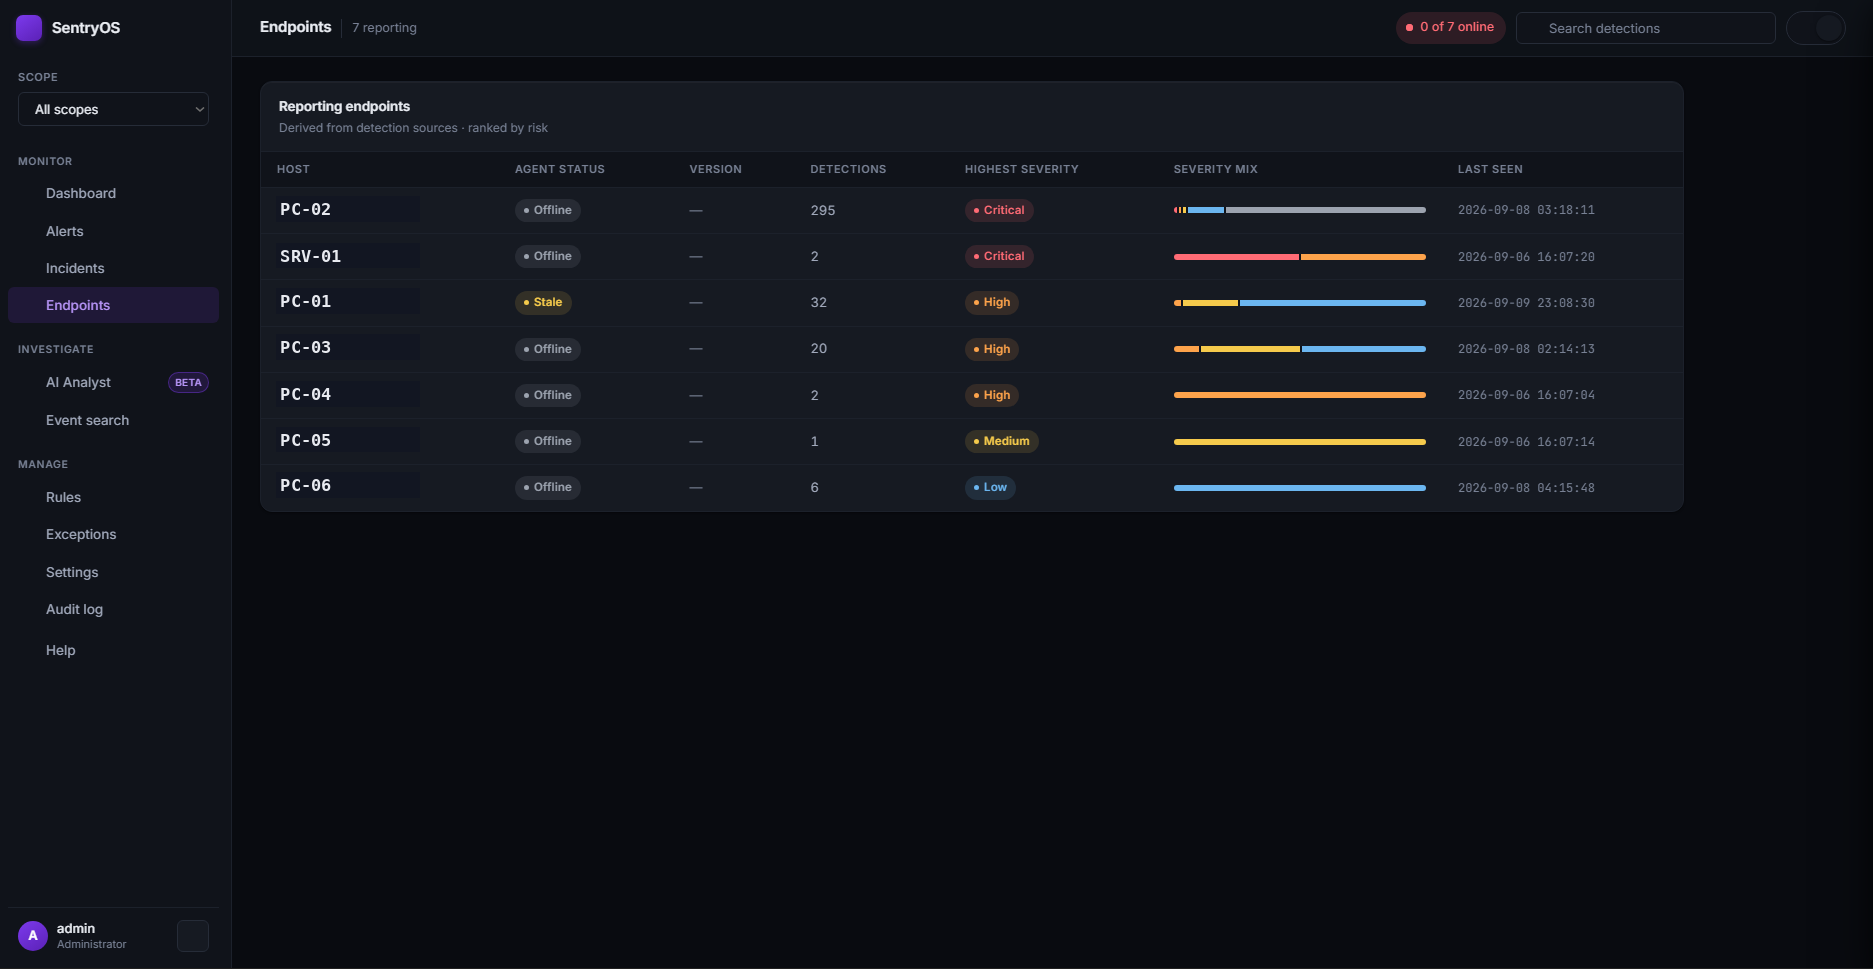
endpoints-sanitized.png
AI Analyst
Pick an alert, ask it a plain question ("did this touch the registry," "is this
the same process as the last one"), and get an answer grounded in that specific
event's raw data. It only ever reasons about the one alert you point it at, not a
general chat about the whole environment.
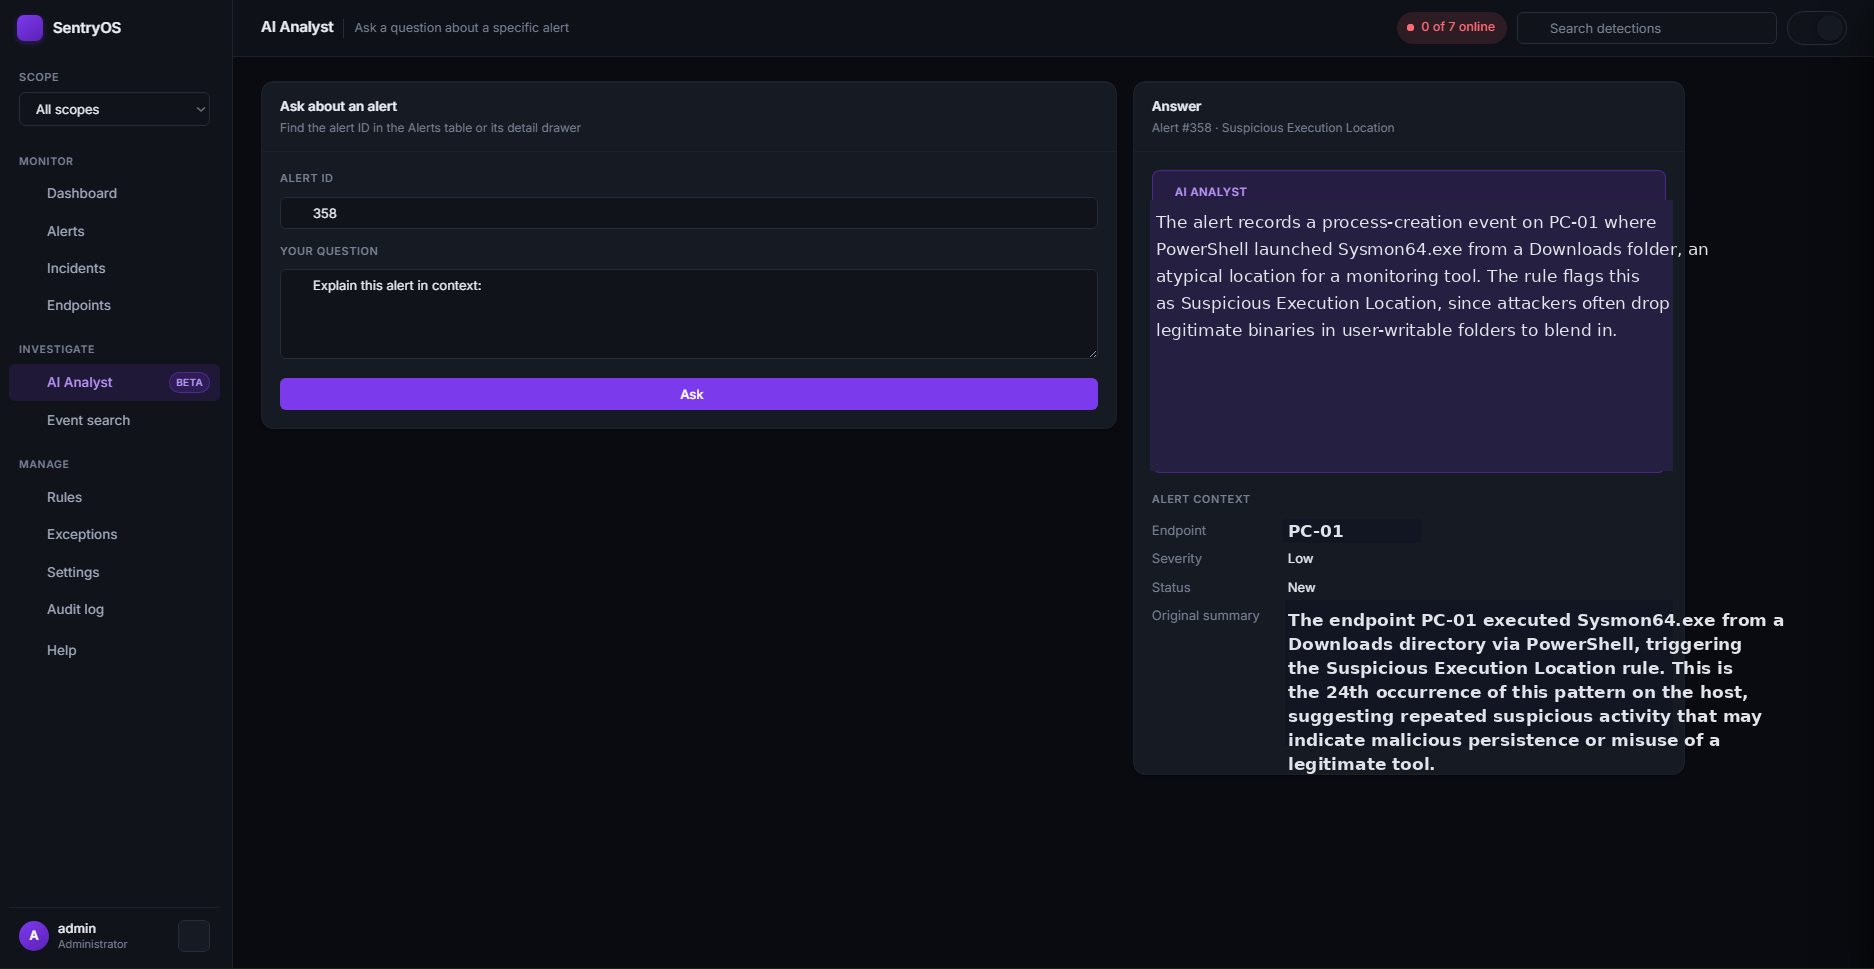
ai-analyst-sanitized.png
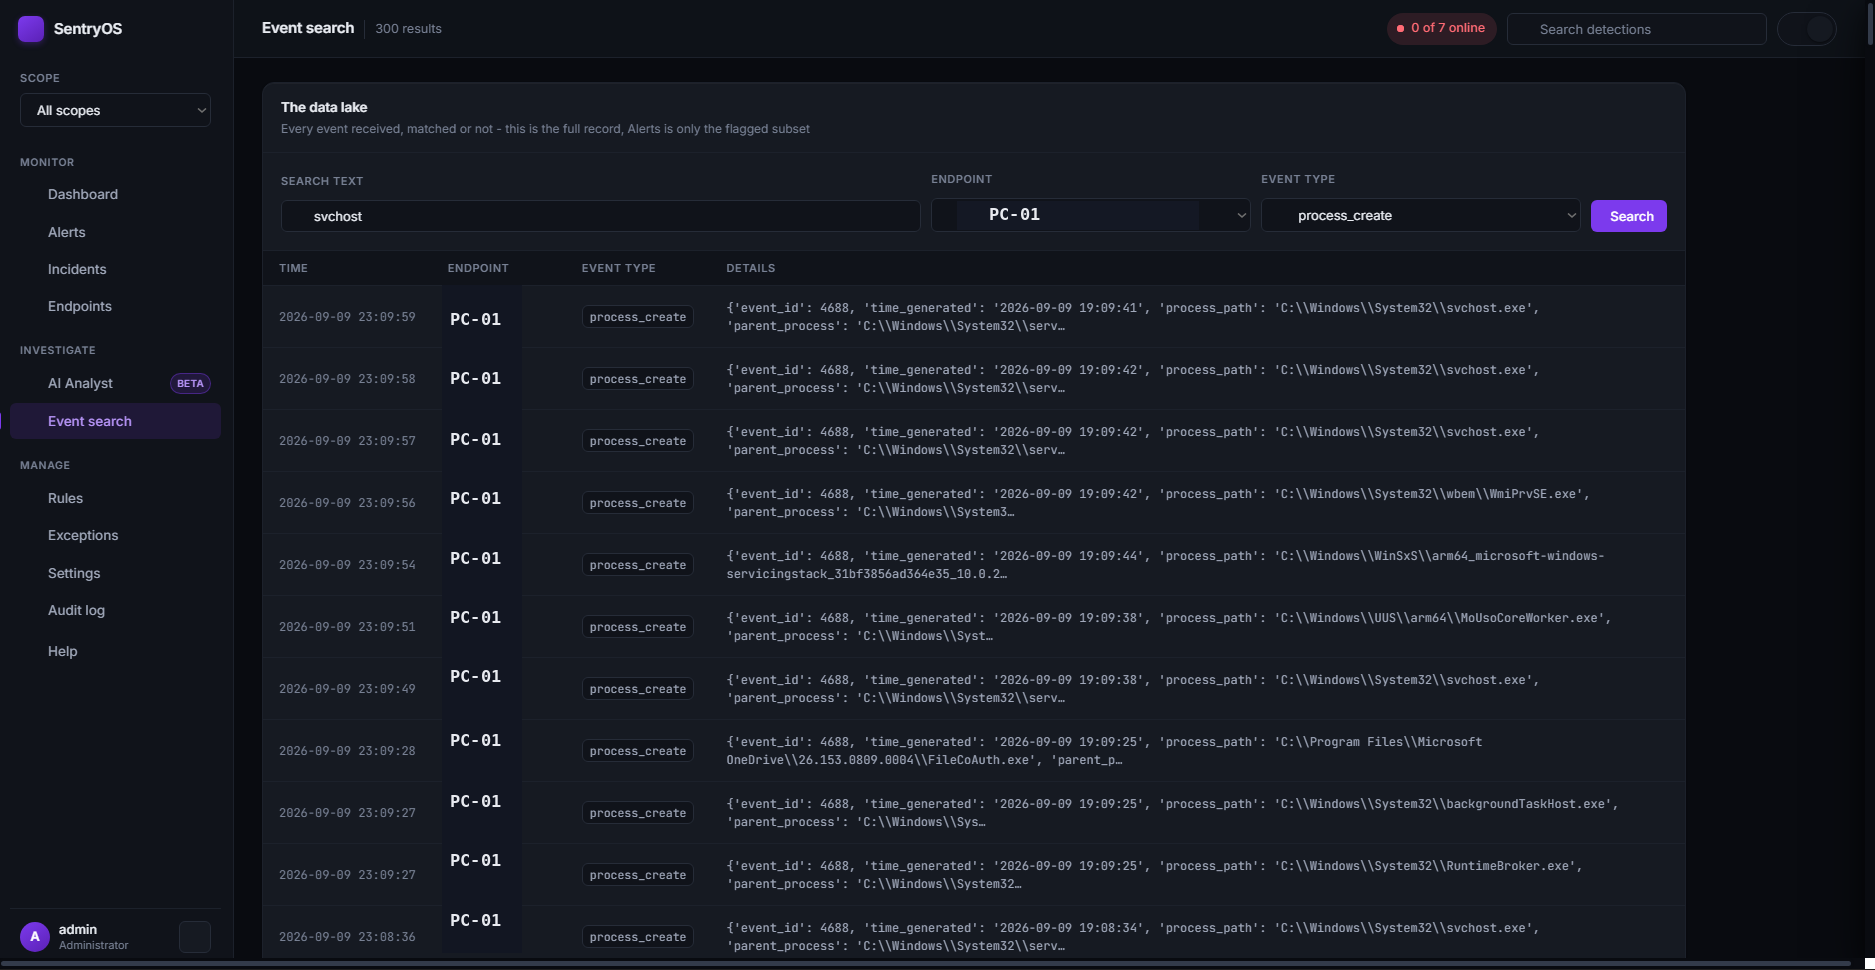
Event Search
The actual data lake: every event the agent ever sent, matched by a rule or not,
searchable by host, type, or free text. Alerts answers "what's worth acting on";
this answers "what actually happened," and the two are deliberately different
questions with deliberately different answers.
event-search-sanitized.png
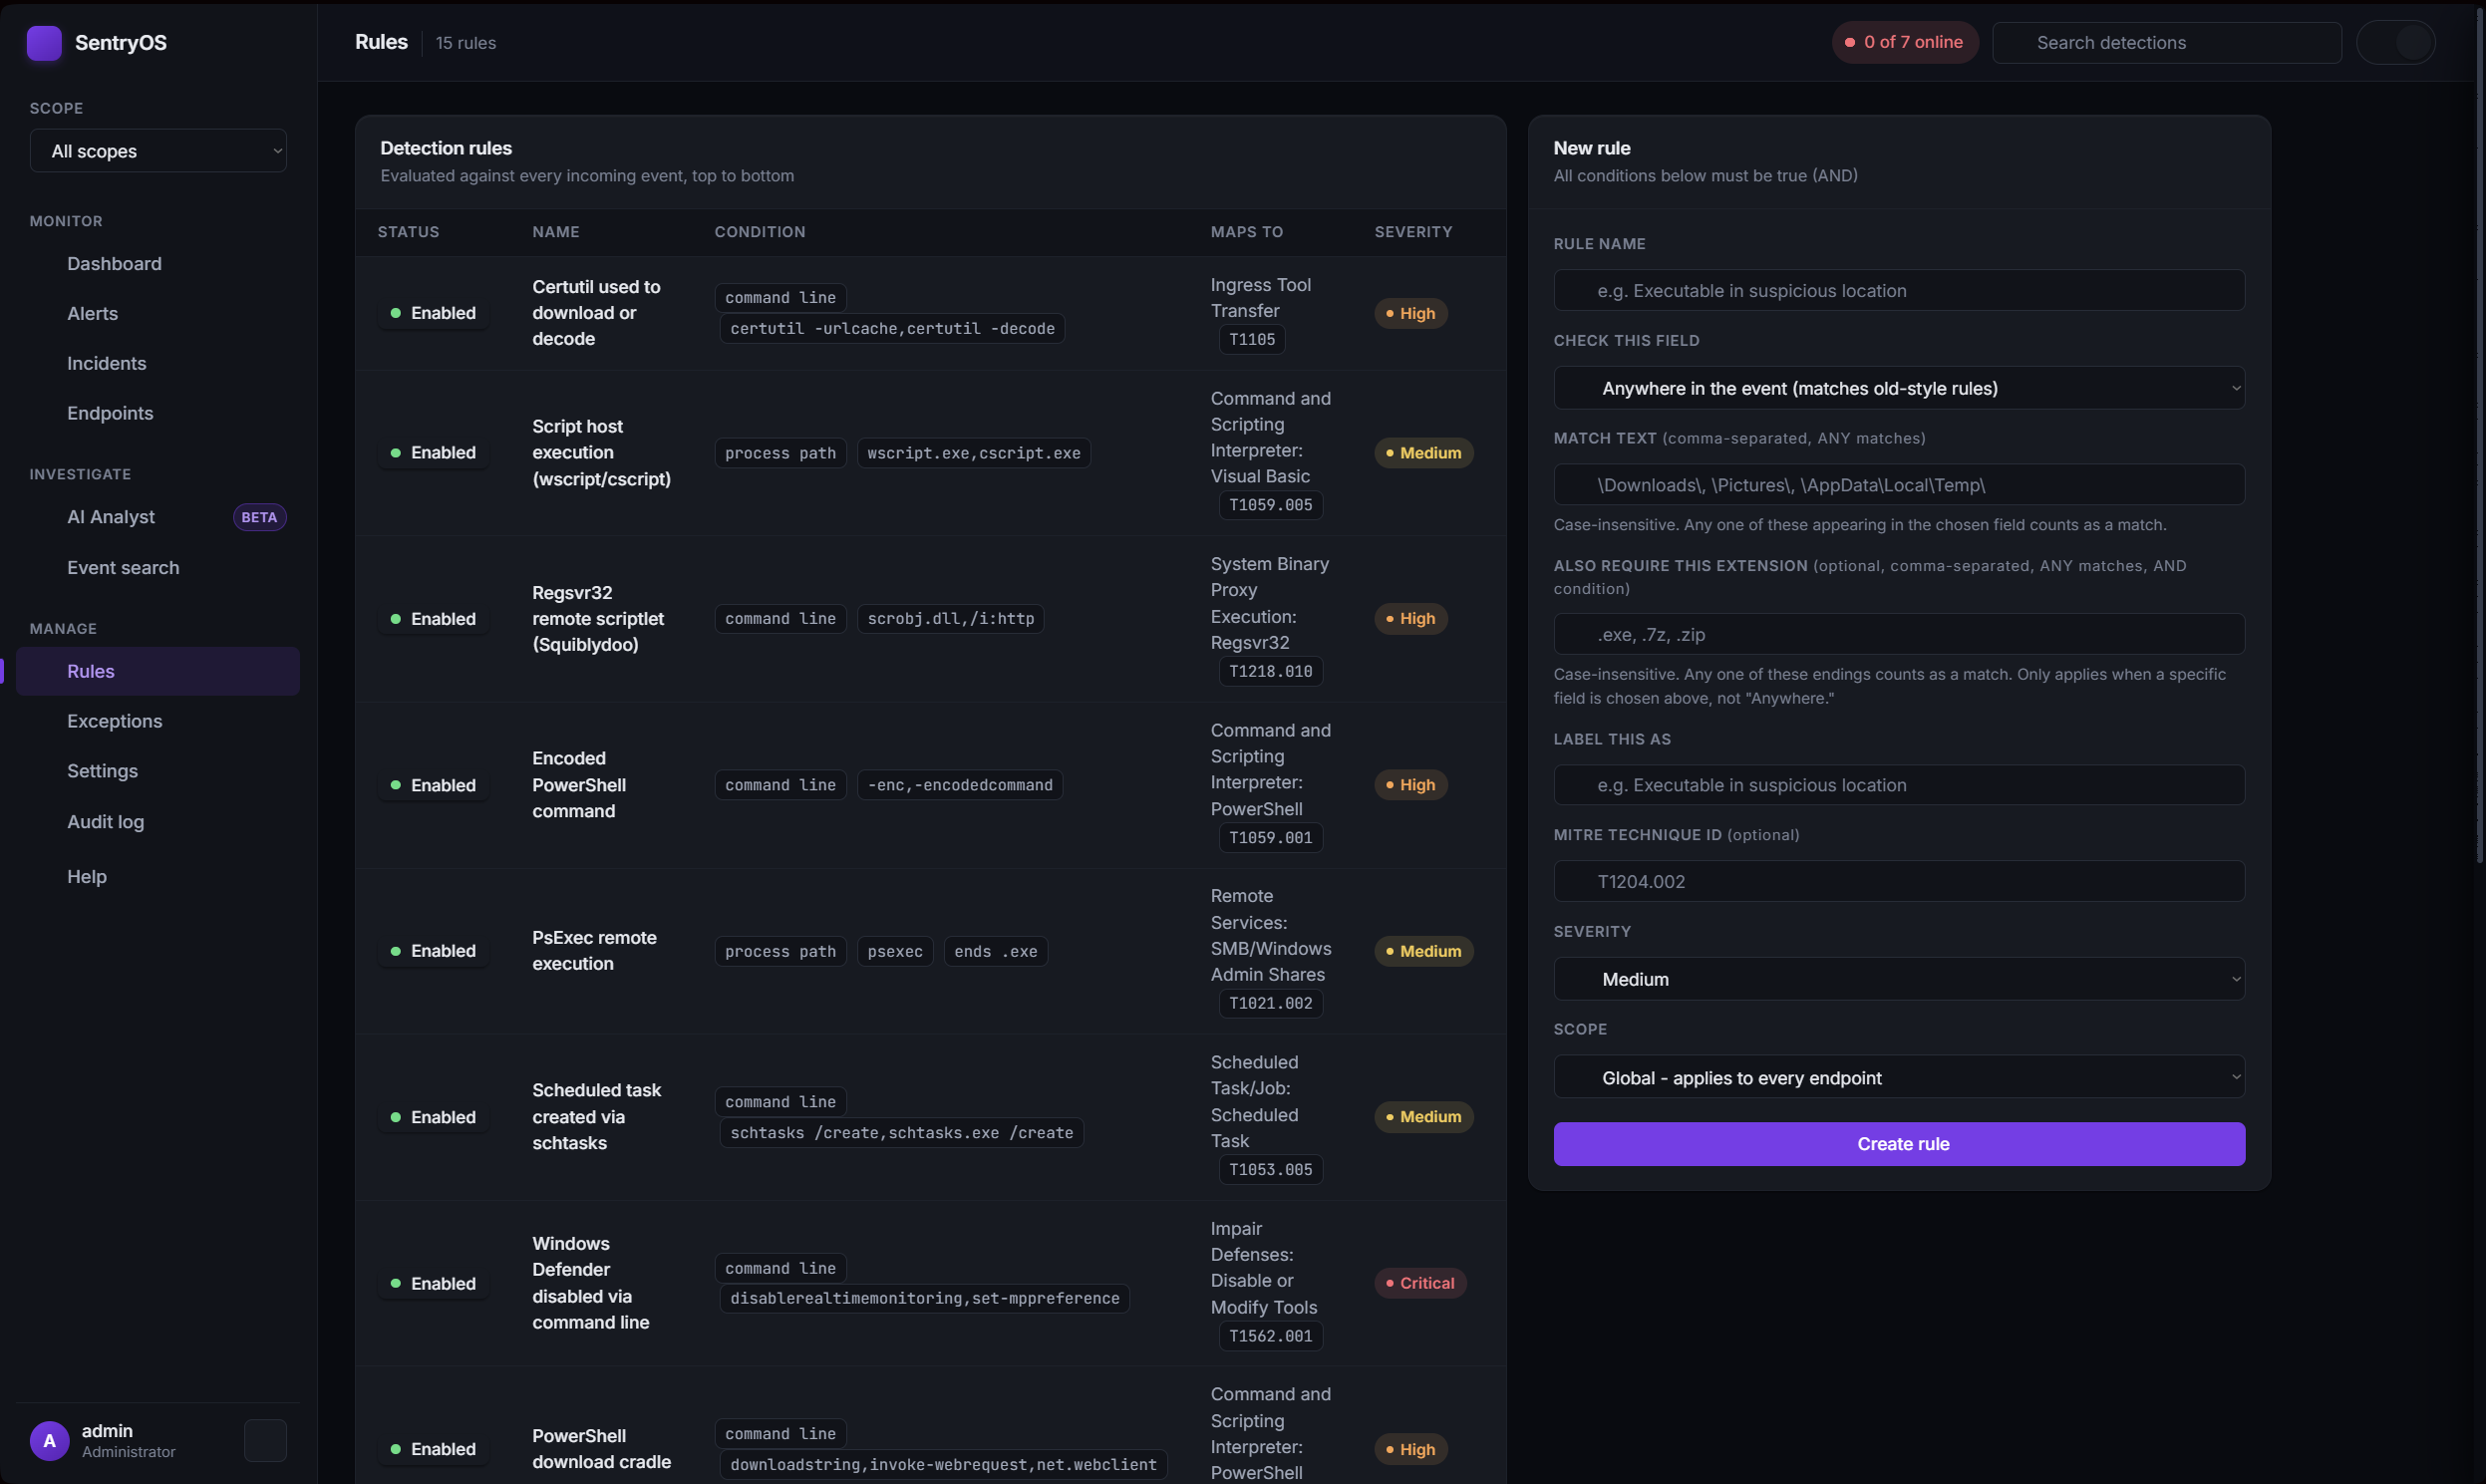
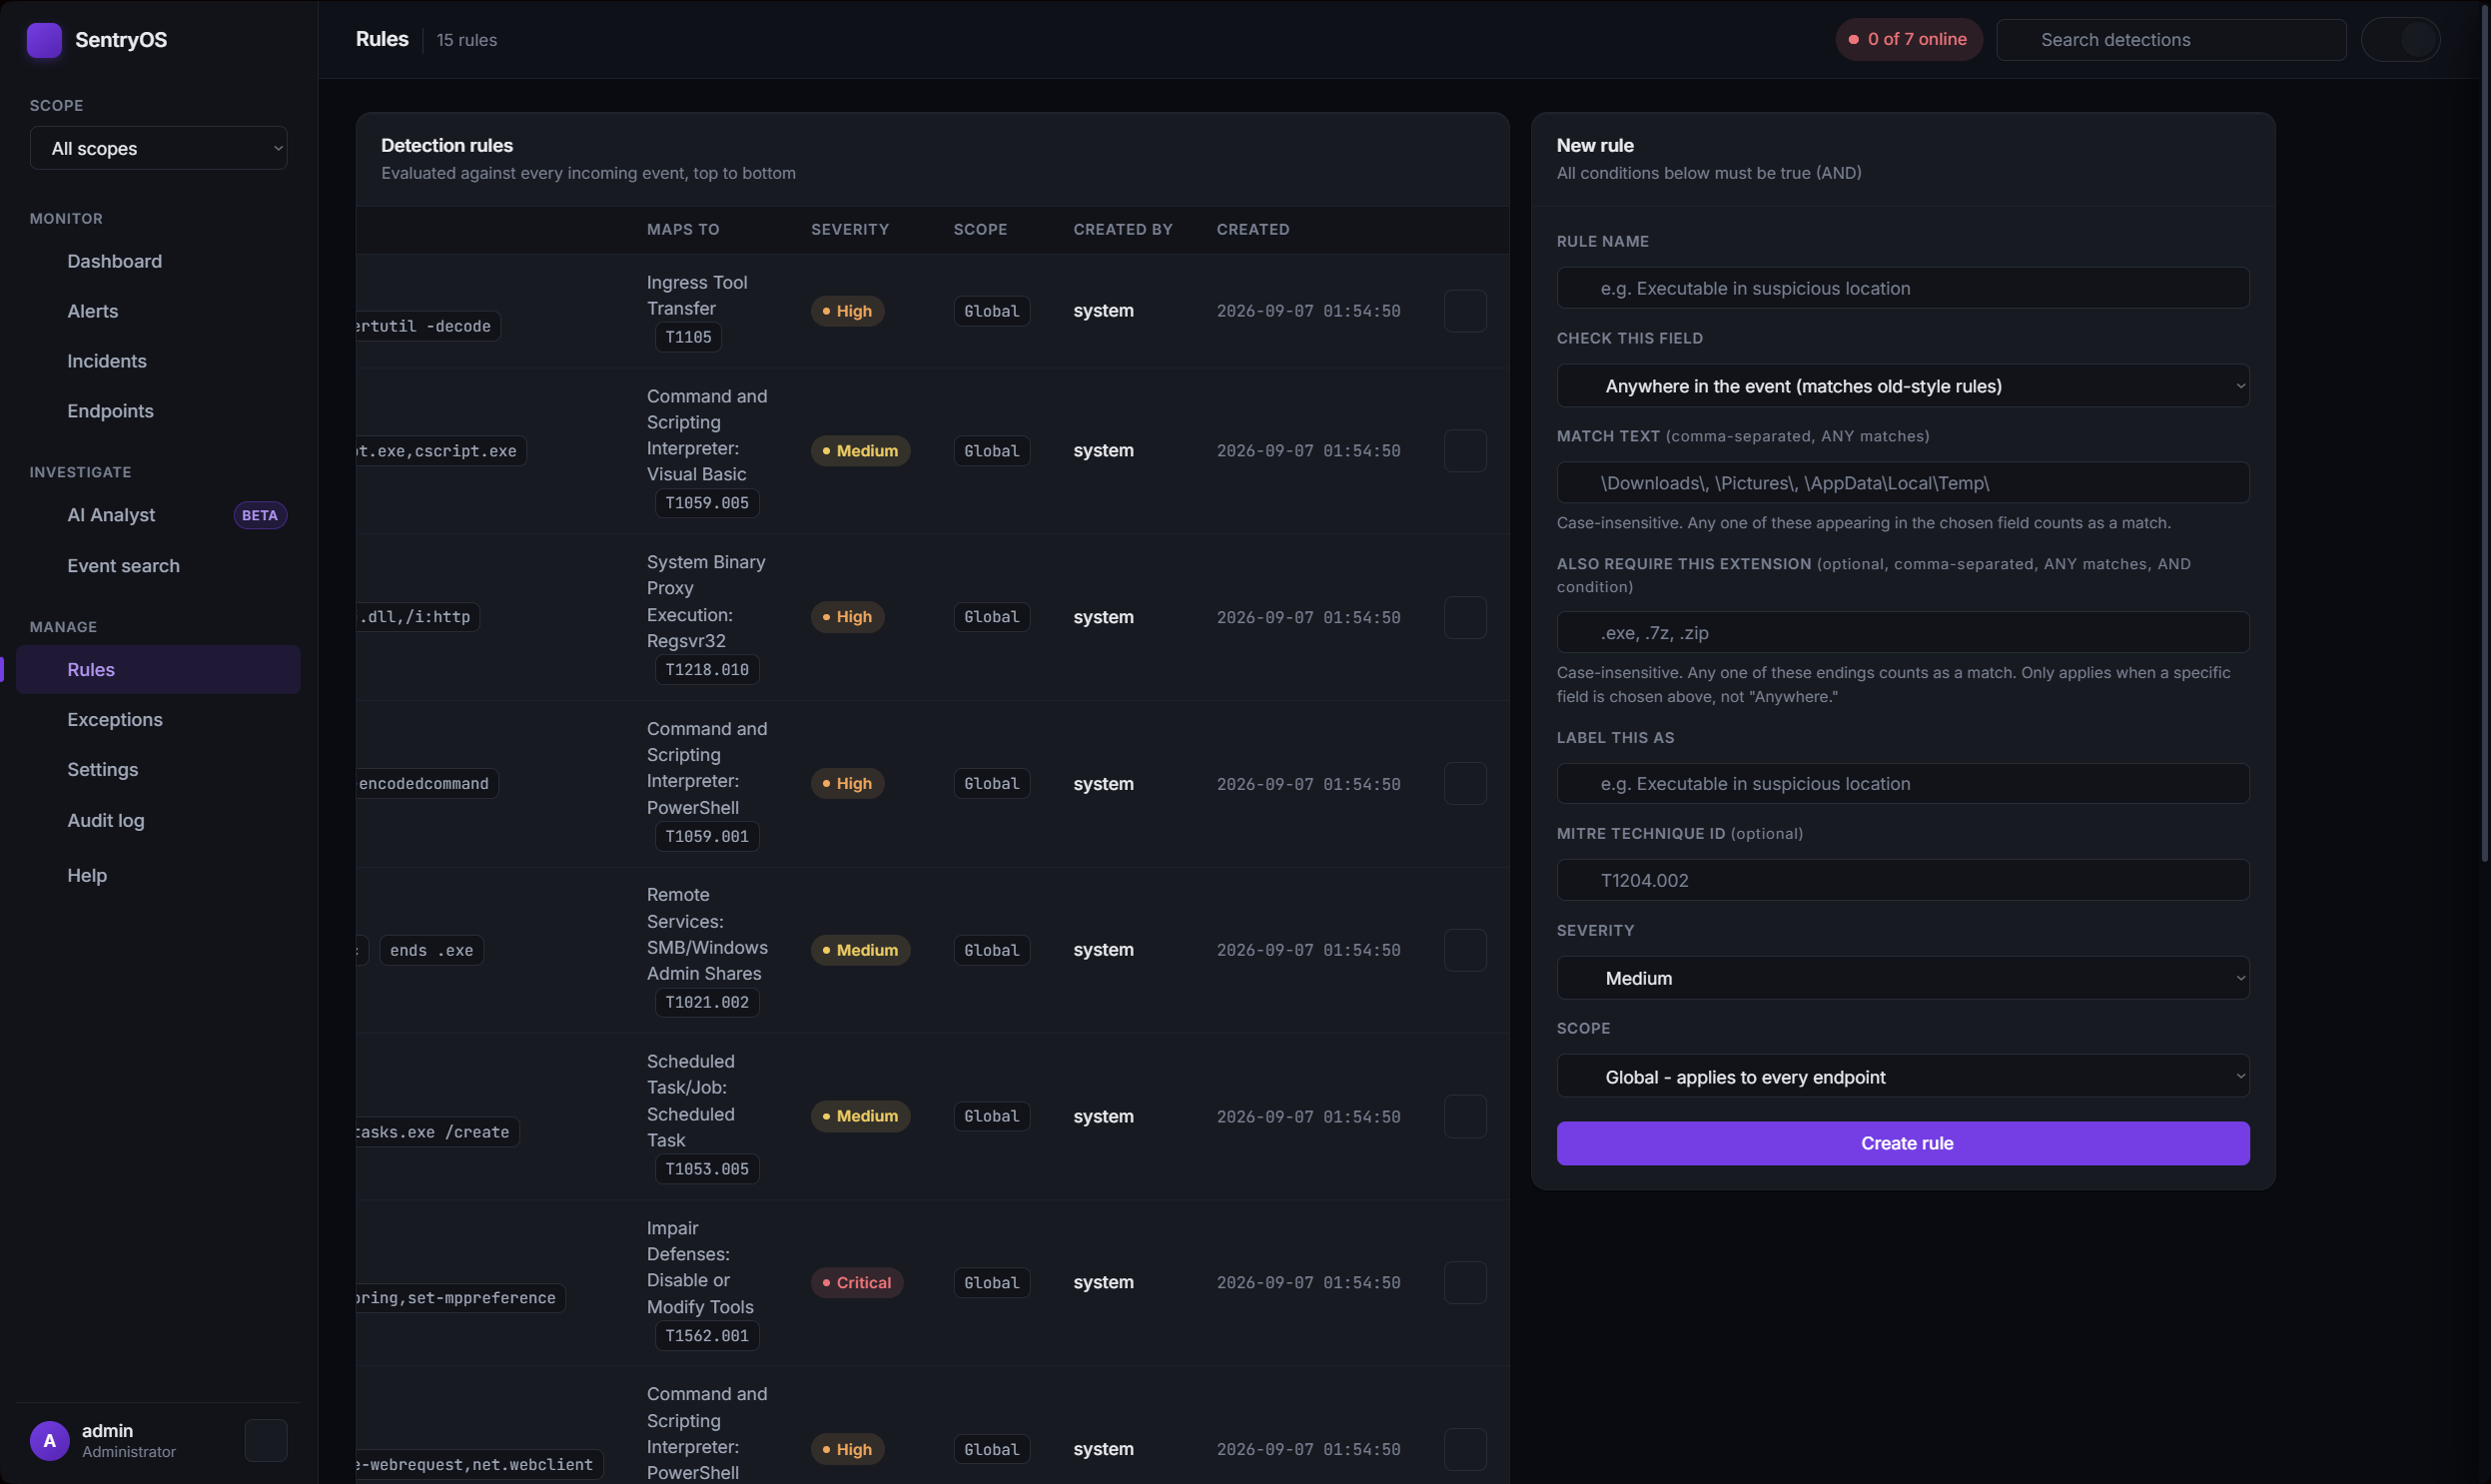
A rules engine anyone can use
Detection logic lives in the database, not in code: write a new rule from the
console and it takes effect on the very next event. Rules can be scoped, so one
person's custom detection only ever fires on their own machines.
rules-scope-left-sanitized.png
rules-scope-right-sanitized.png
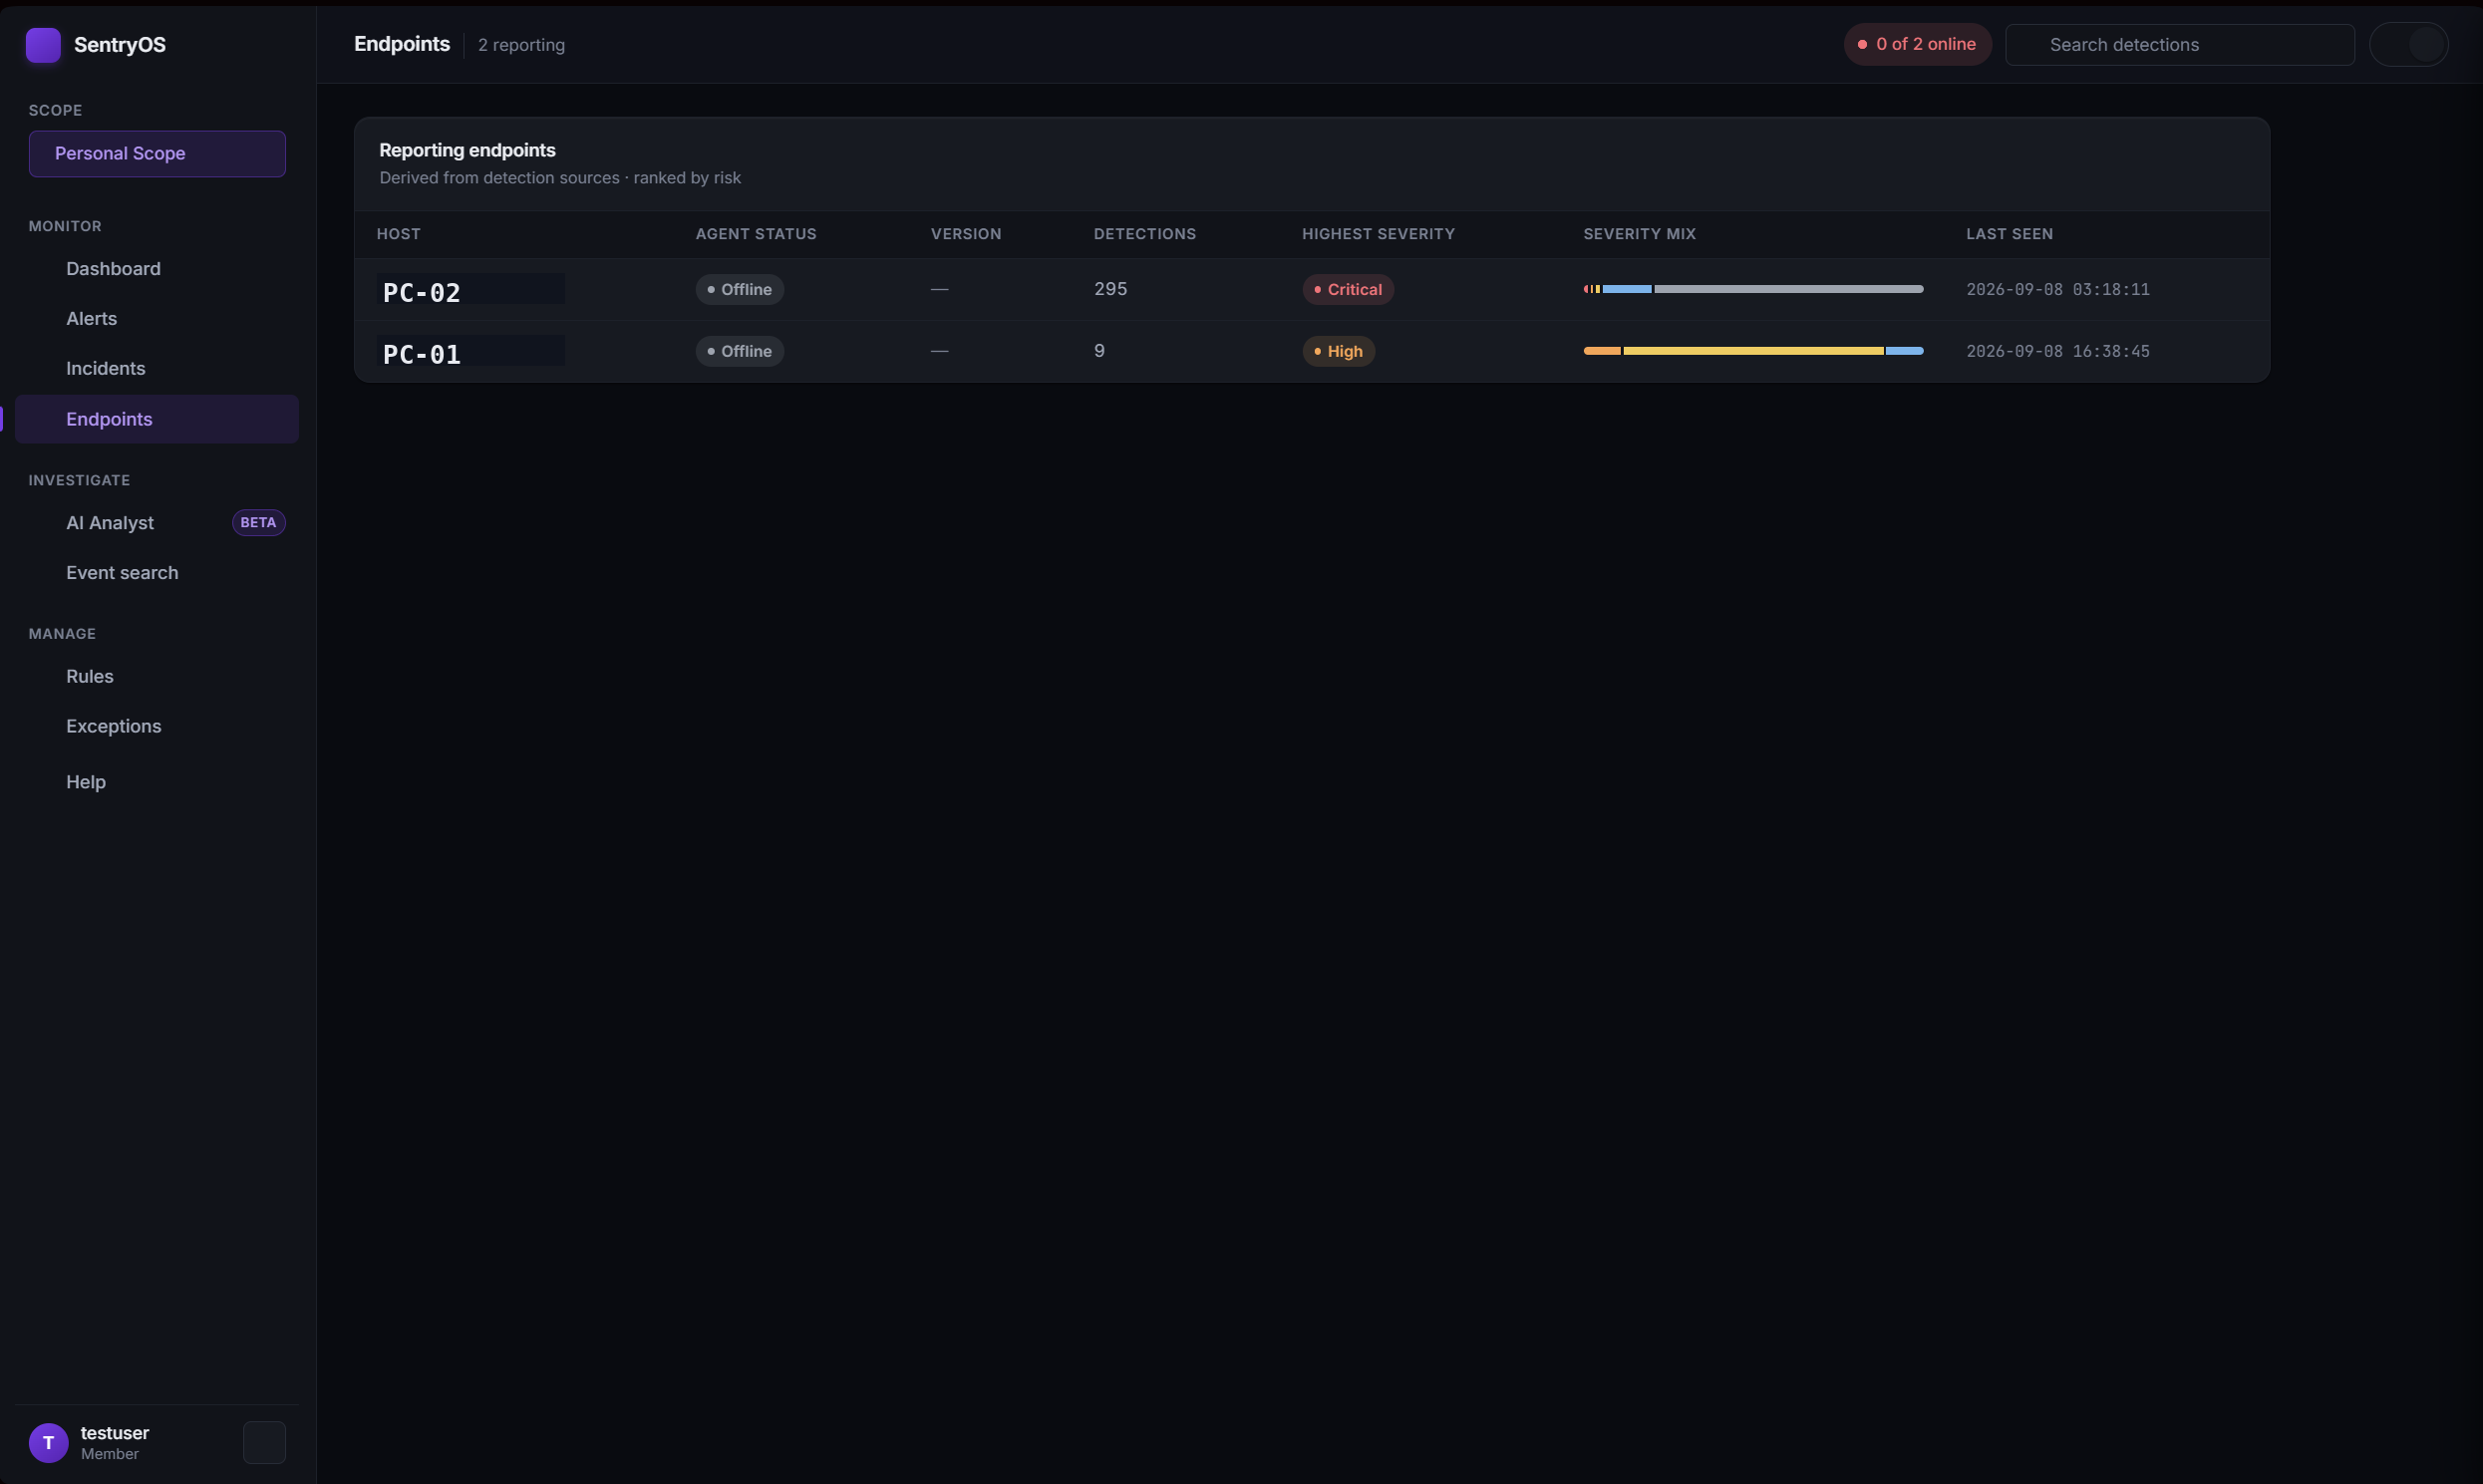
Real account boundaries
Every user is scoped to their own set of endpoints, enforced on the server, not
just hidden in the UI. A member can write their own rules and never sees, or
affects, anyone else's machines.
multi-tenant-member-sanitized.png
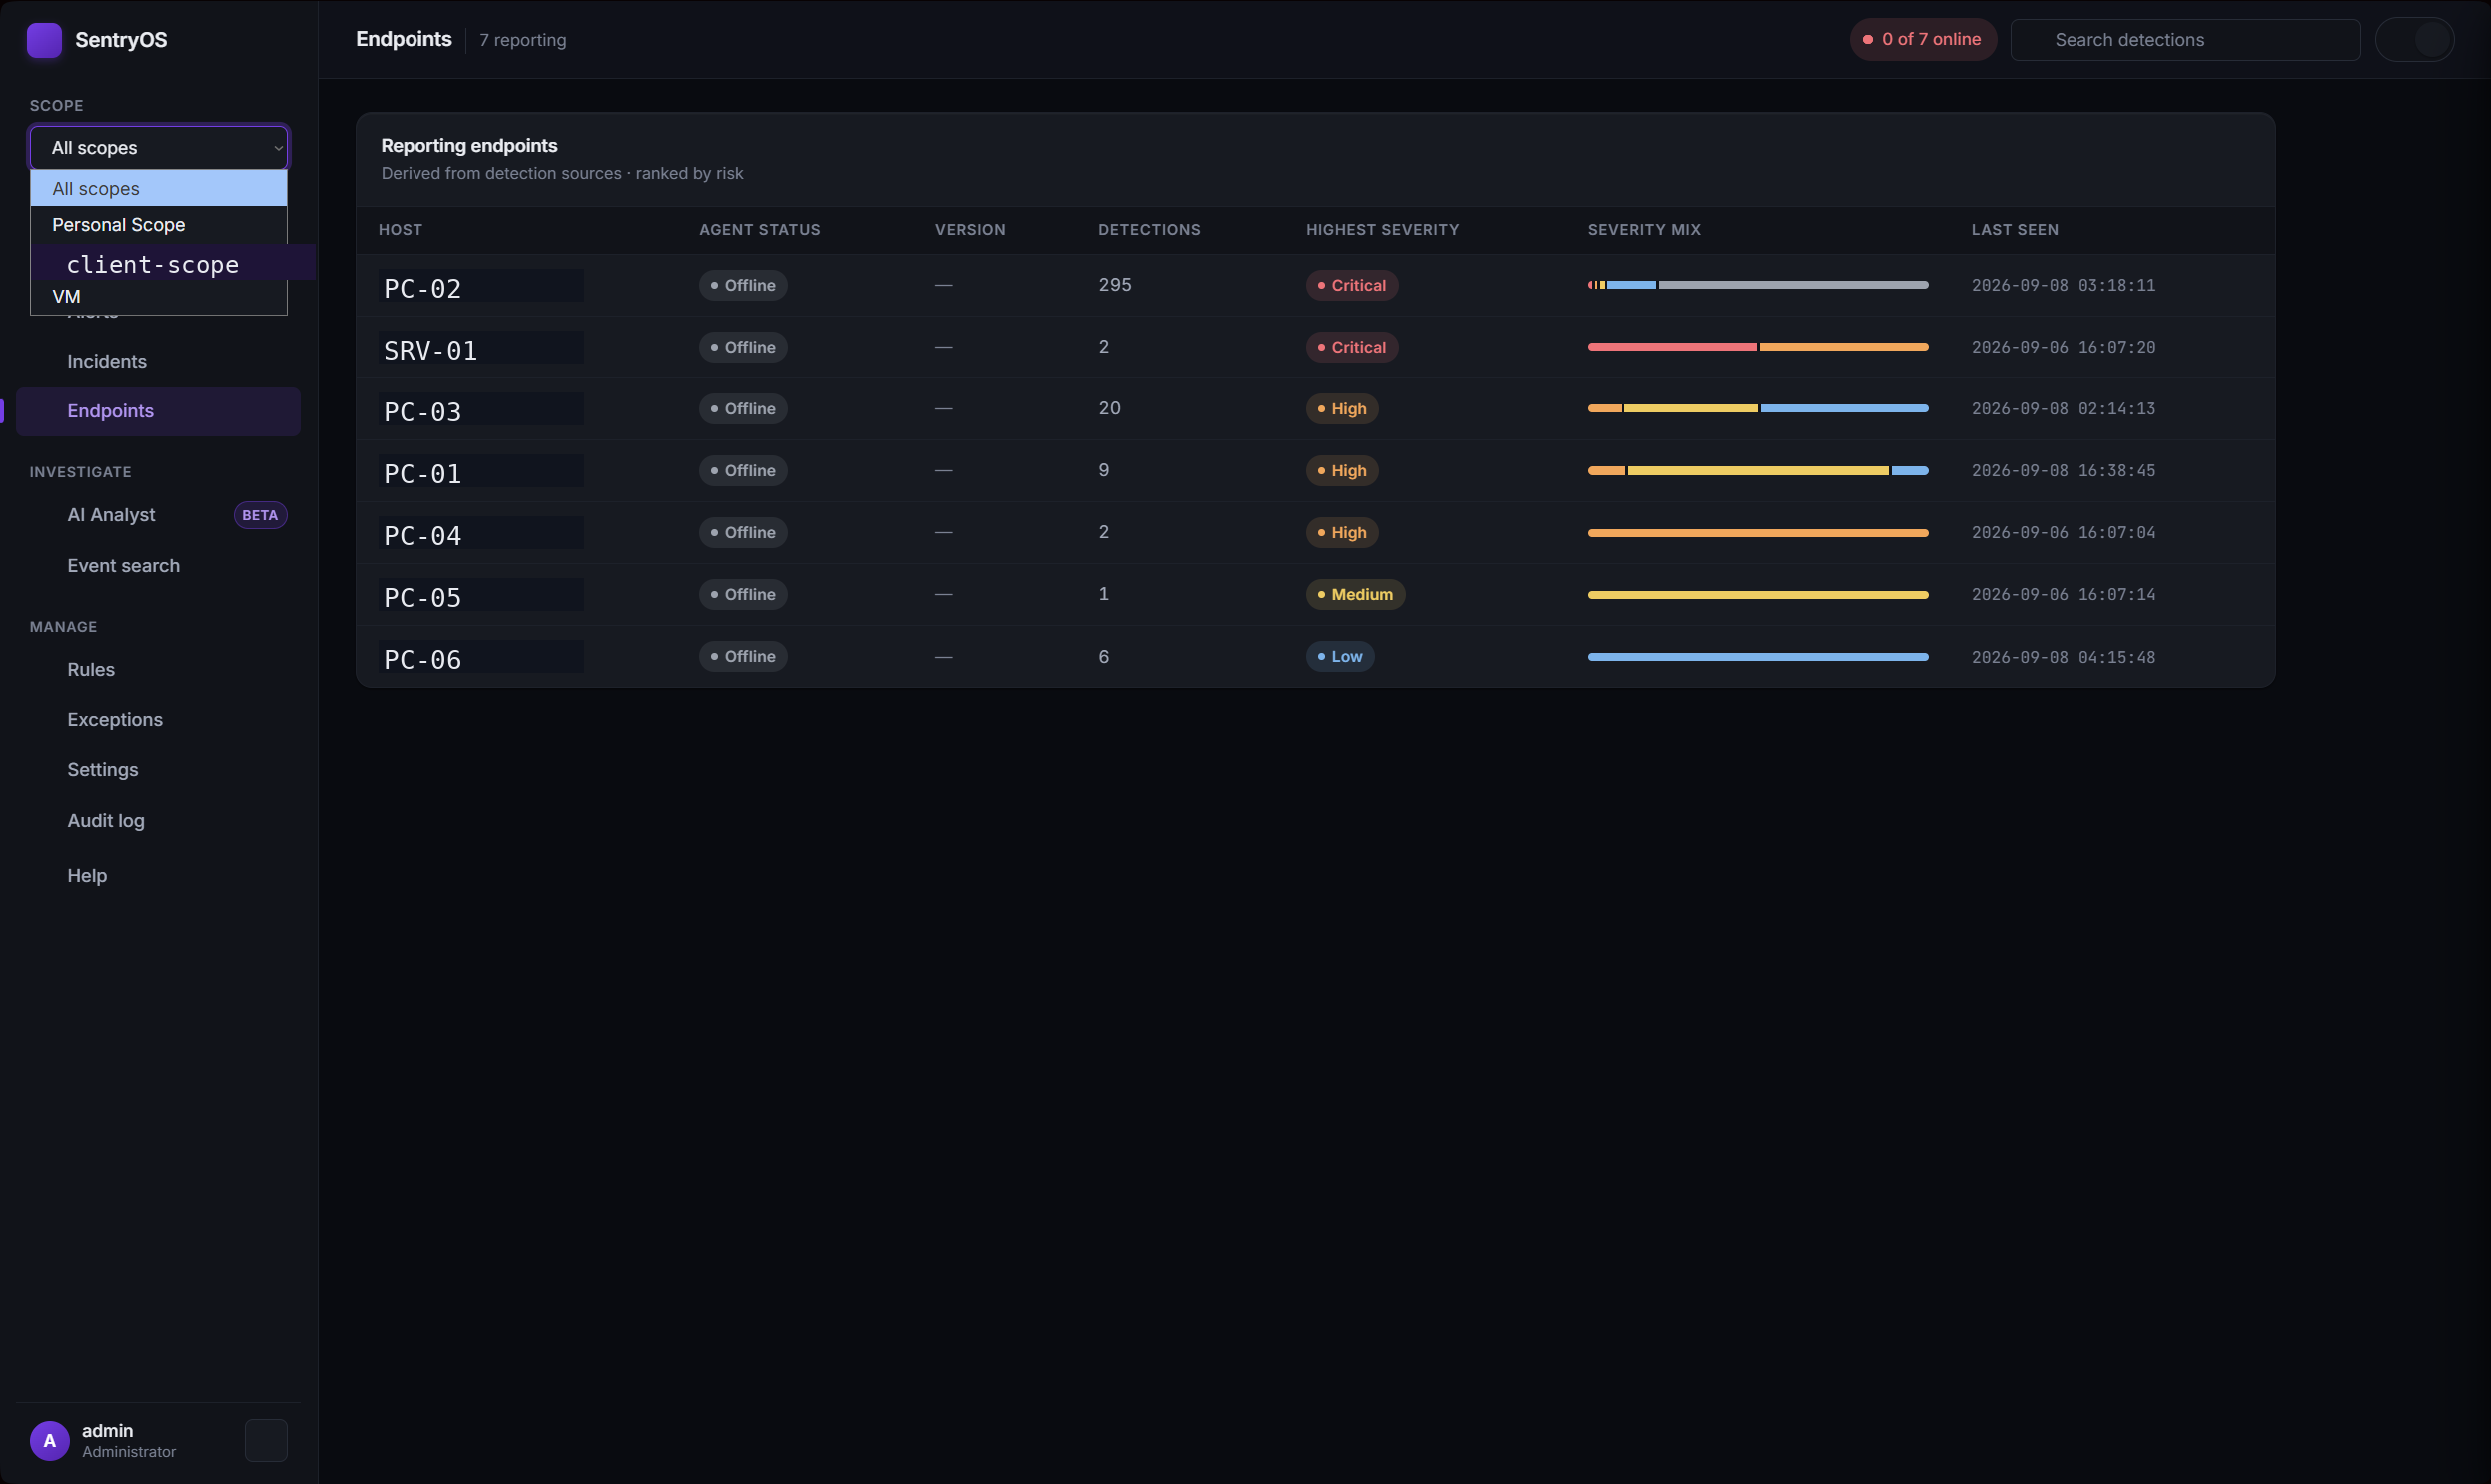
multi-tenant-admin-sanitized.png
Exceptions
An allowlist that sits above rule matching: a specific file hash or process name
can get suppressed without touching the rule that caught it, so one known-good file
stops alerting without weakening the rule for everything else it's supposed to
catch.
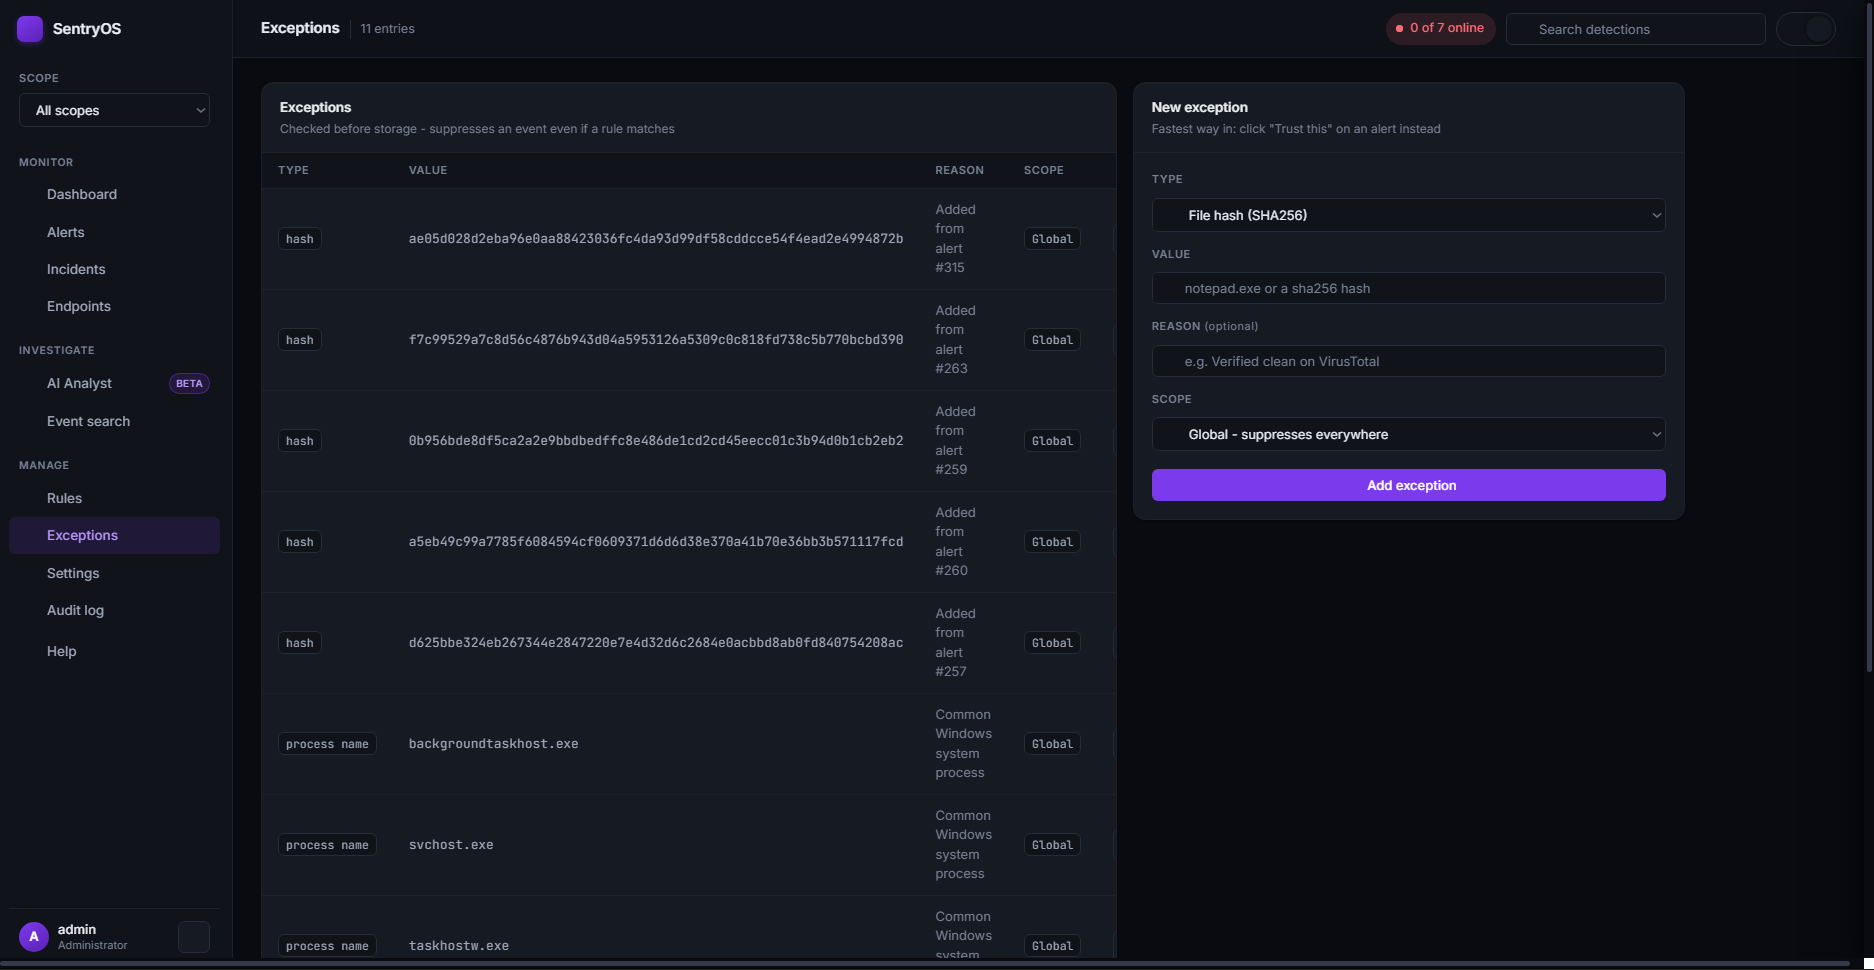
exceptions-sanitized.png
Settings
The actual admin control surface behind everything above: creating scopes,
assigning endpoints to them, adding users with a role and a scope, generating
license keys, and publishing the current agent version. This is where "multi-tenant"
stops being a design decision and becomes a page someone actually clicks through.
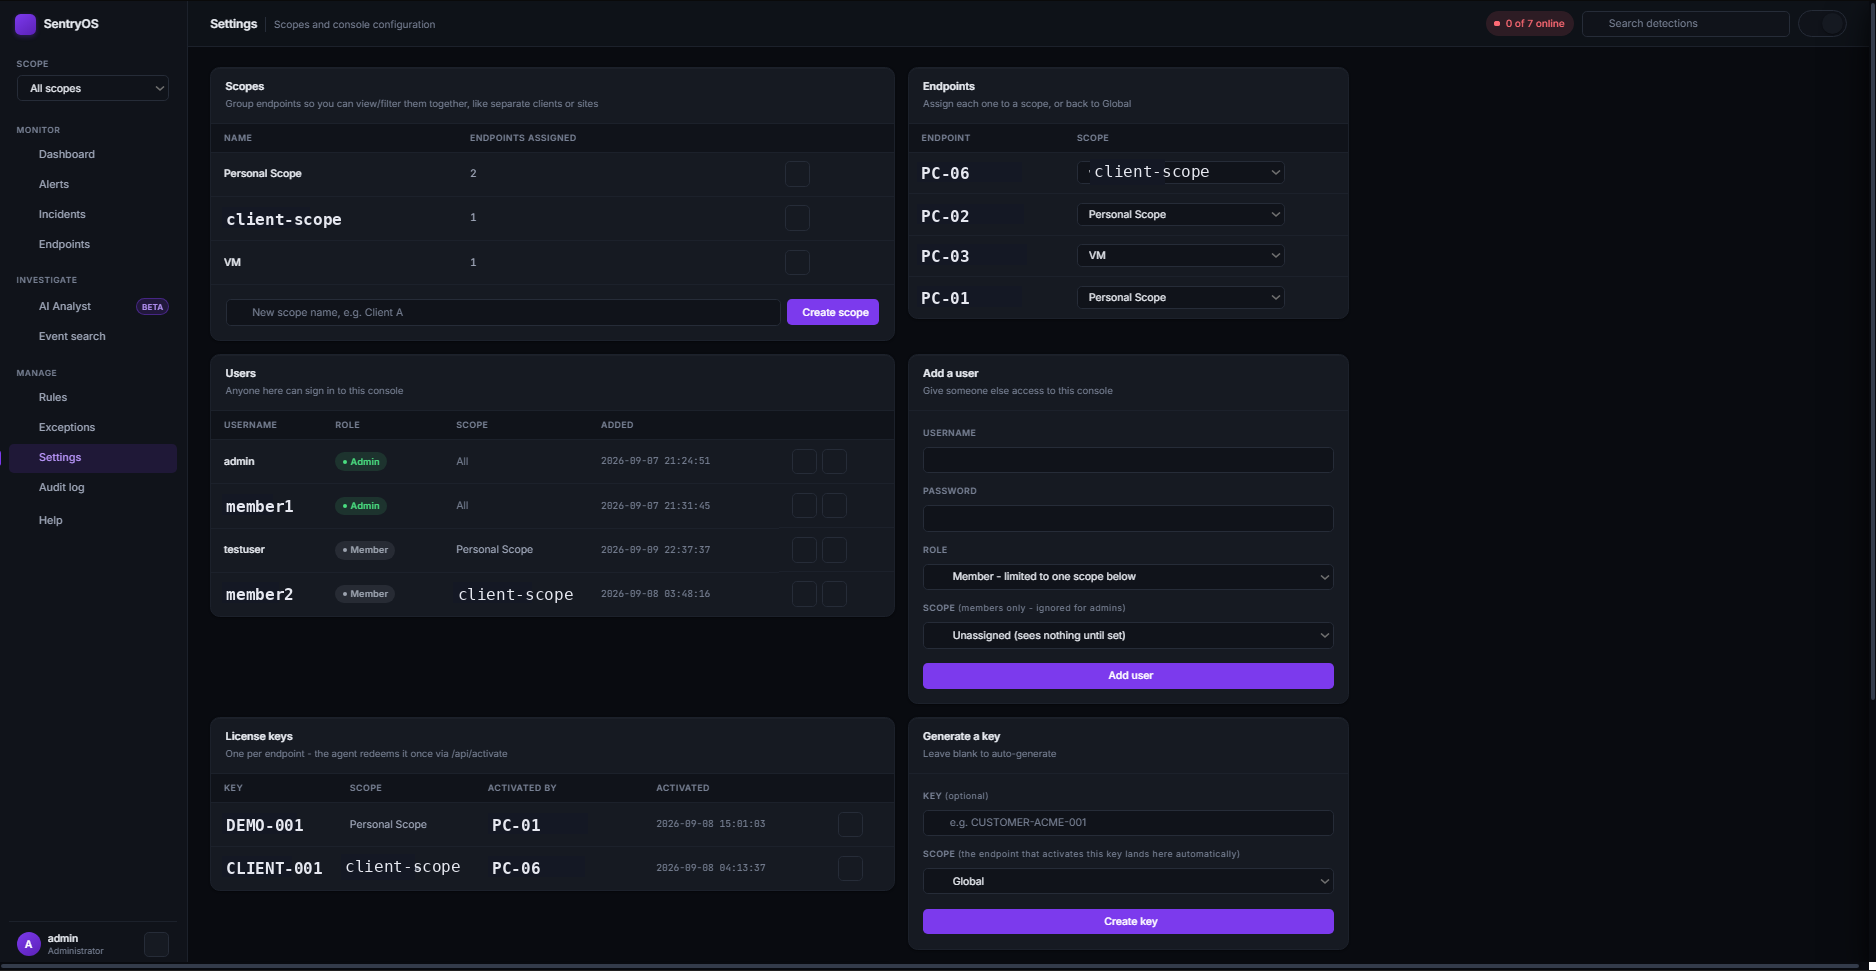
settings-sanitized.png
Audit log
Who resolved an alert, who created a rule, who added a user, and when, going back
as far as the log retains. The kind of thing that turns "I think someone changed
that rule" into an actual answer instead of a guess.
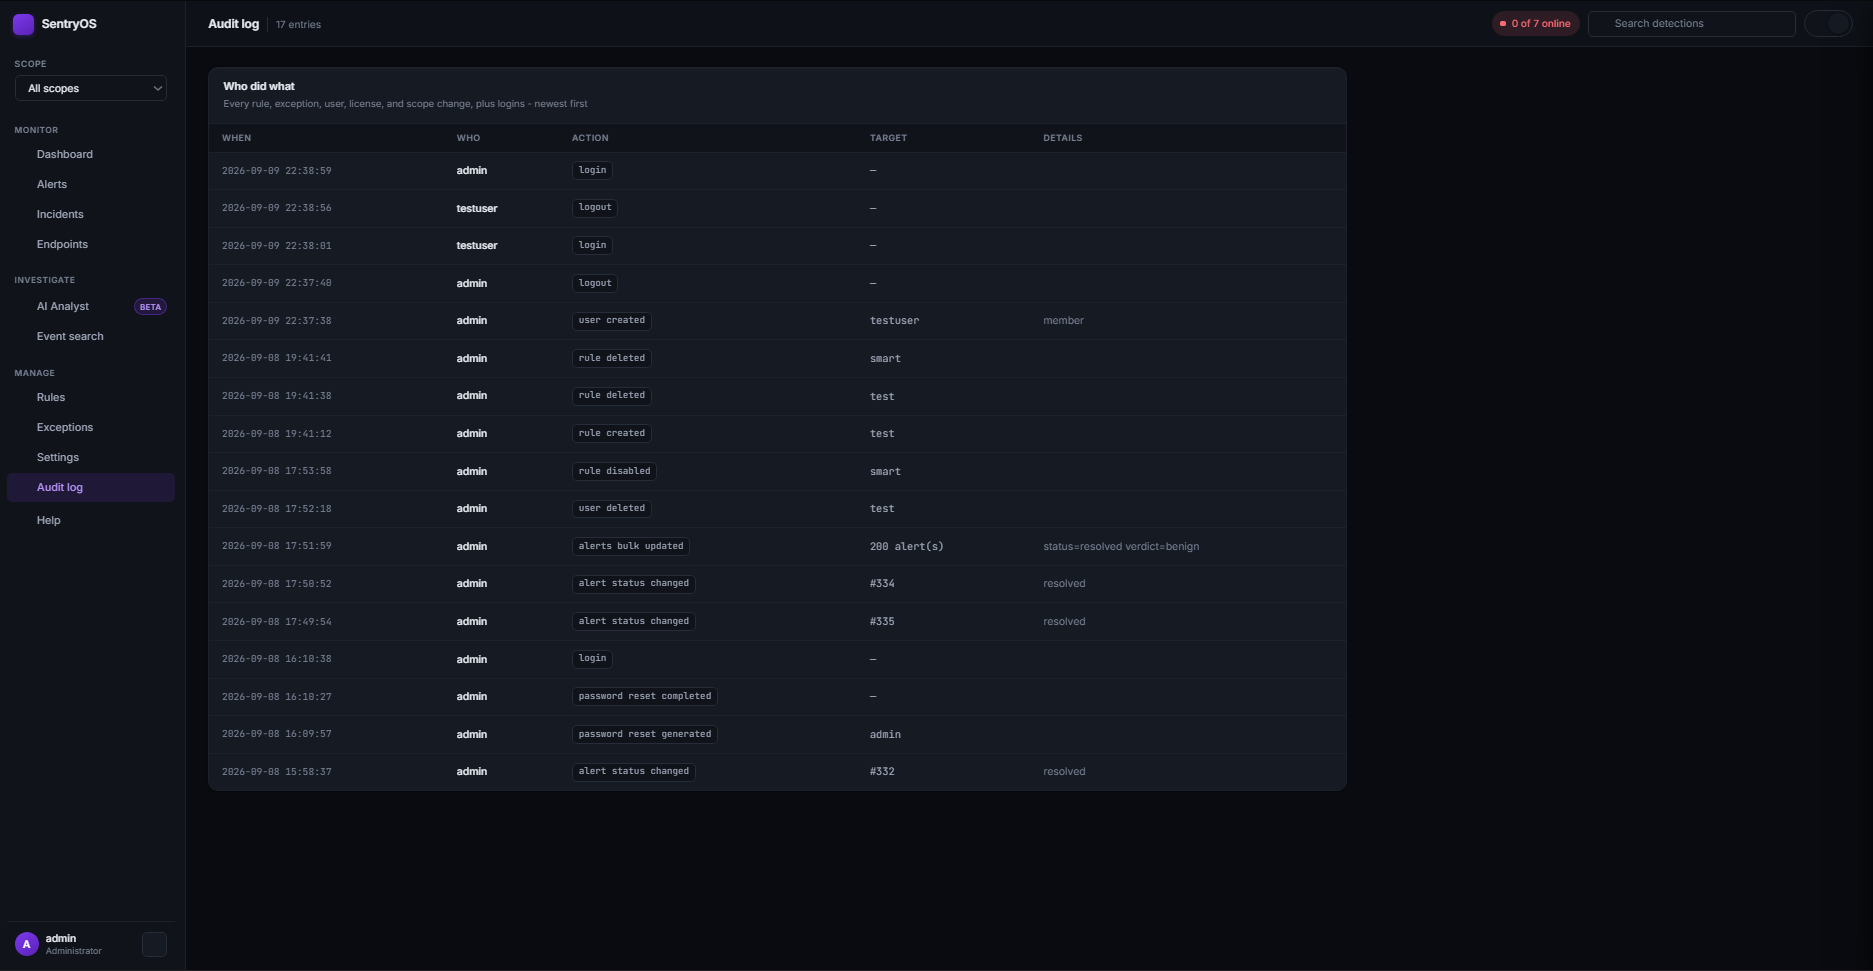
audit-log-sanitized.png
Login and account recovery
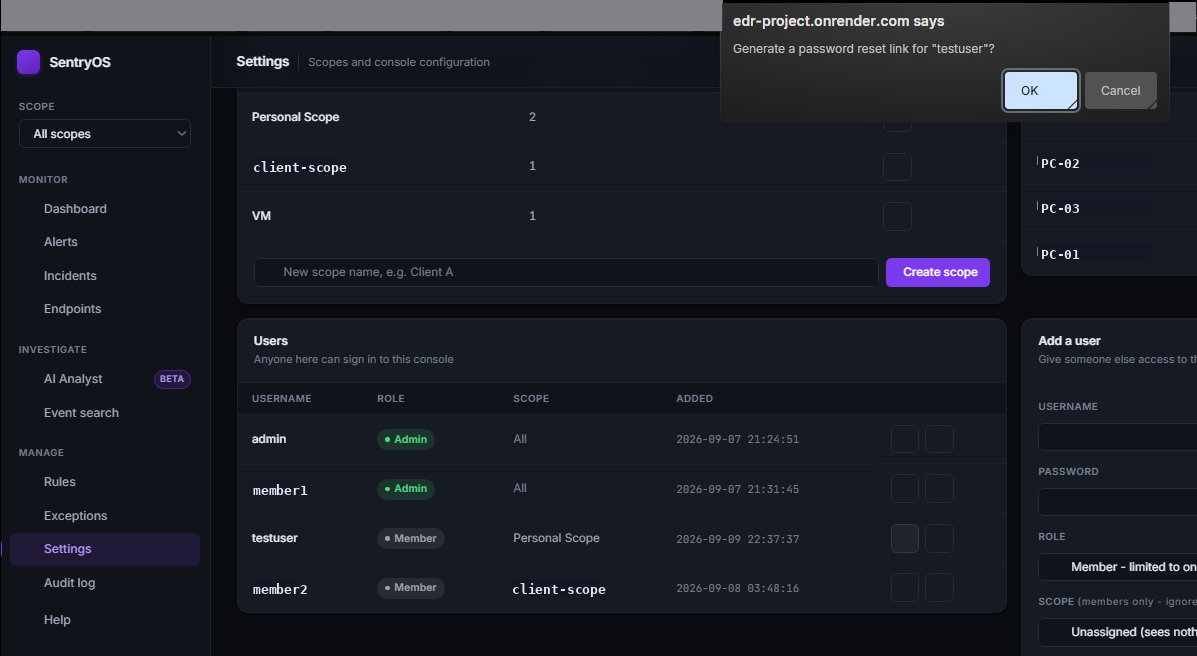
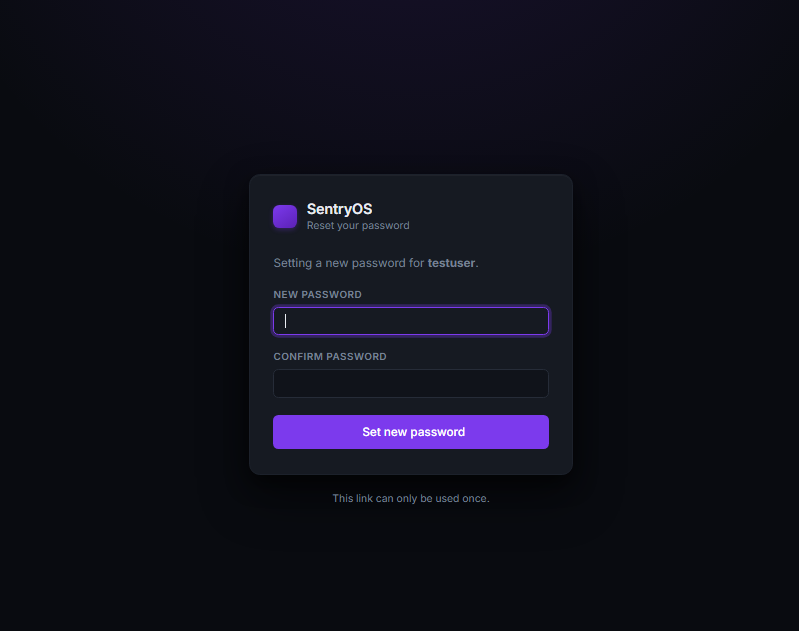
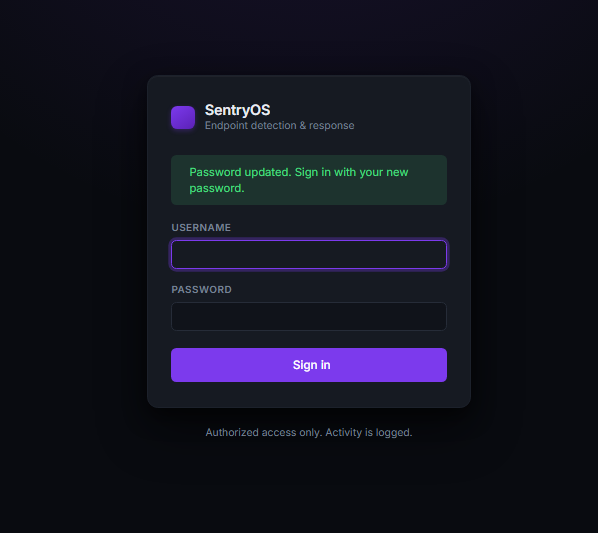
Five failed attempts locks an account for fifteen minutes. There's no email
service wired up, so instead of a self-serve "forgot password" form, an admin
generates a single-use reset link from Settings and sends it directly, solving the
same real problem without needing an email pipeline this project doesn't have.
login-reset-dialog-sanitized.png

login-reset-link-sanitized.png
login-reset-form-sanitized.png
login-success-sanitized.png
The agent itself
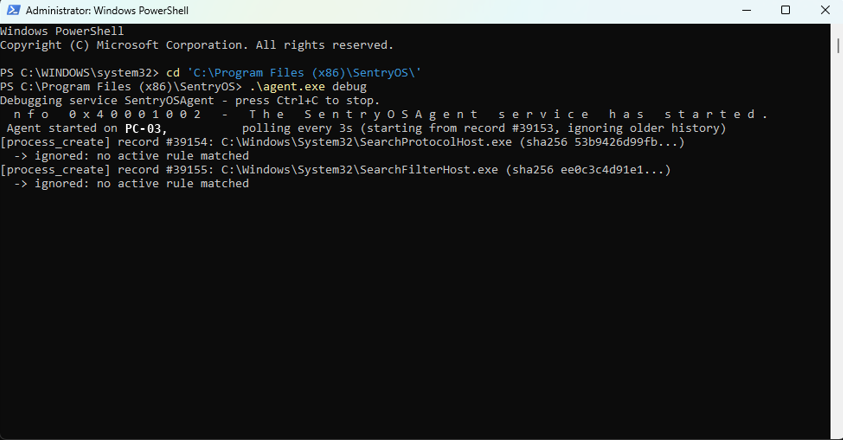
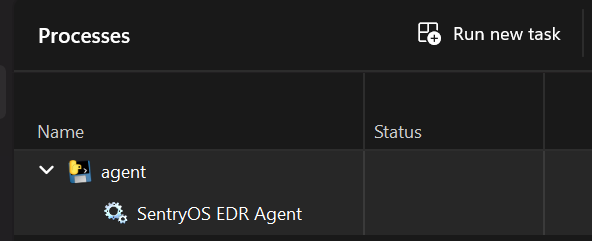
Runs as an actual Windows Service: SYSTEM-level, starts at boot, no logged-in
user required. It reads native Windows auditing for process creation, and Sysmon
for network connections, cross-process memory access, and file writes.
agent-terminal-sanitized.png
An installer that does the boring parts for you
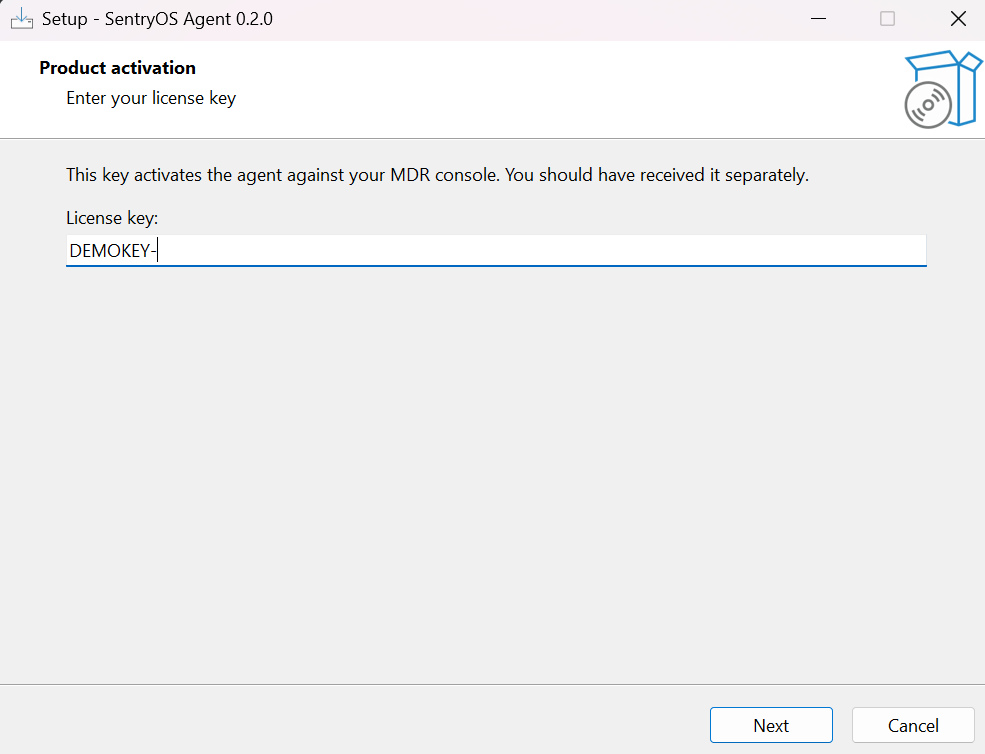
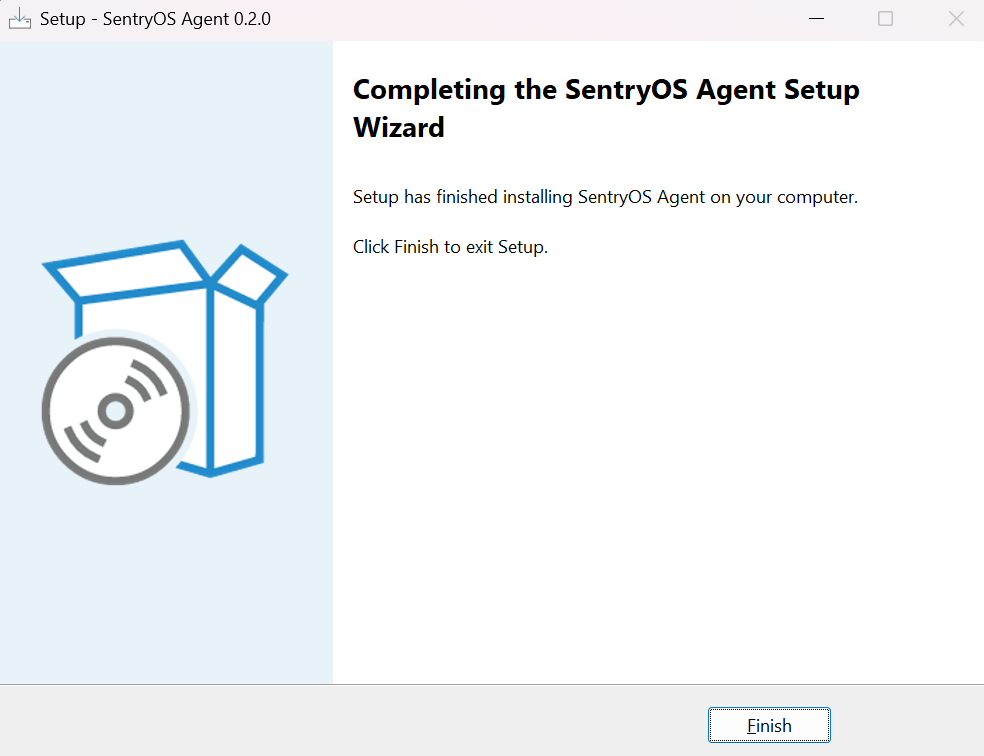
One double-click: prompts for a license key, silently turns on the Windows
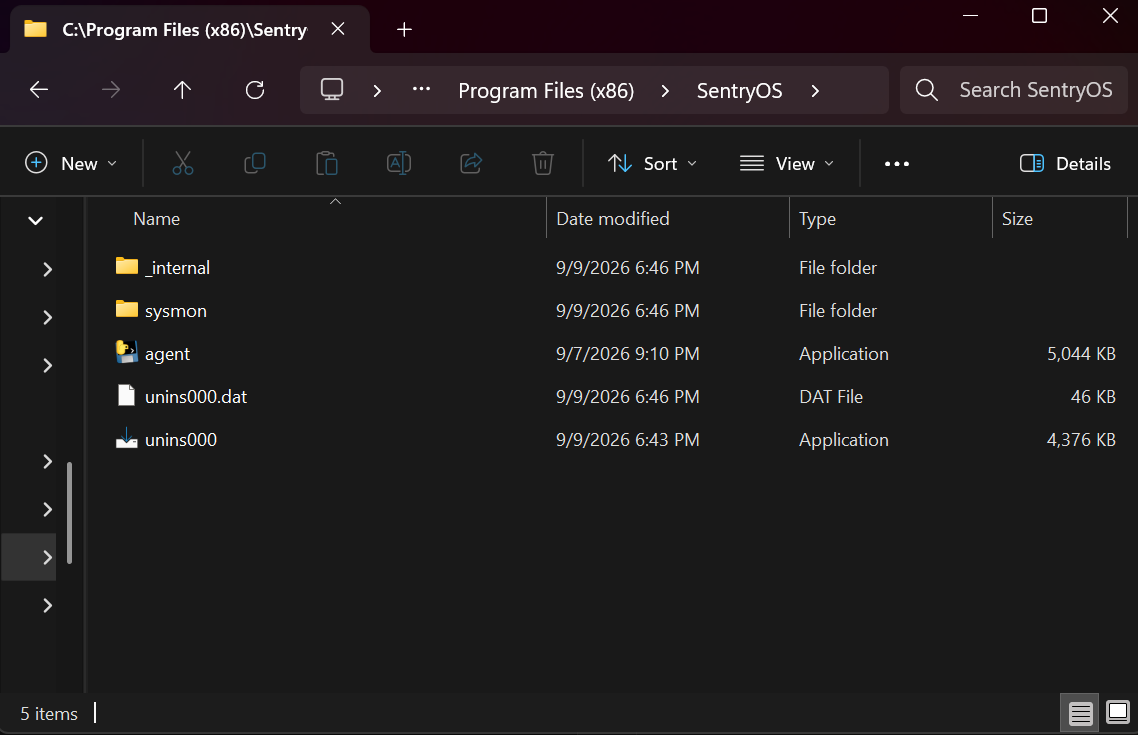
auditing settings the agent needs, installs Sysmon with a scoped config, and
registers the agent as a service, with no PowerShell and no manual steps.
installer-wizard-key-sanitized.png
installer-wizard-finish-sanitized.png
installer-wizard-files-sanitized.png
installer-wizard-running-sanitized.png